We use graphs often in newspapers, websites, apps and business meetings. They aren’t always are typical graphs used in the mathematics classroom. We need to be able to read and understand them.
Worked Example
The temperature on 5th September is given by the following graph:
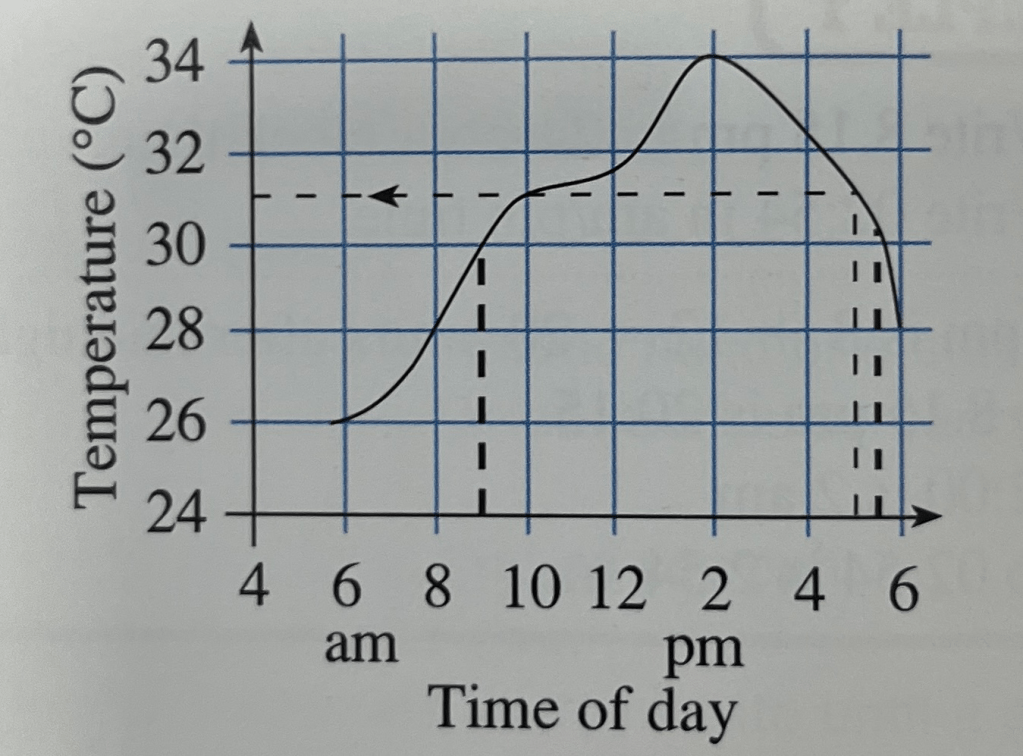
What was the temperature at 8am?
What was the temperature at 5pm?
When was the temperature 30ºC?
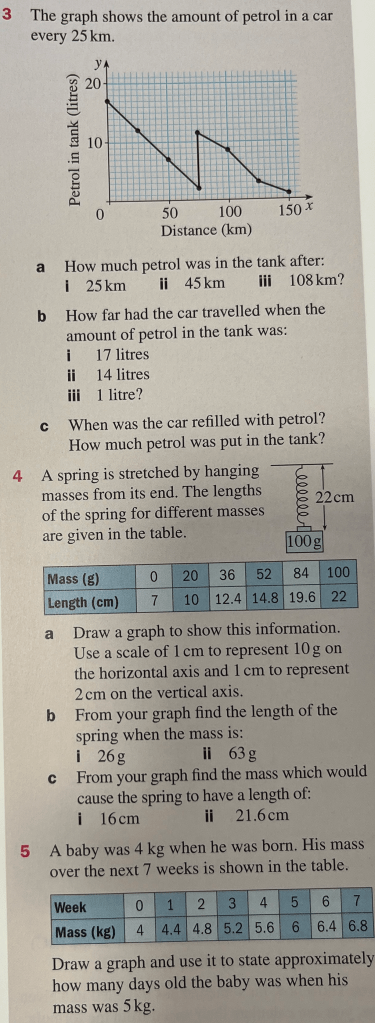
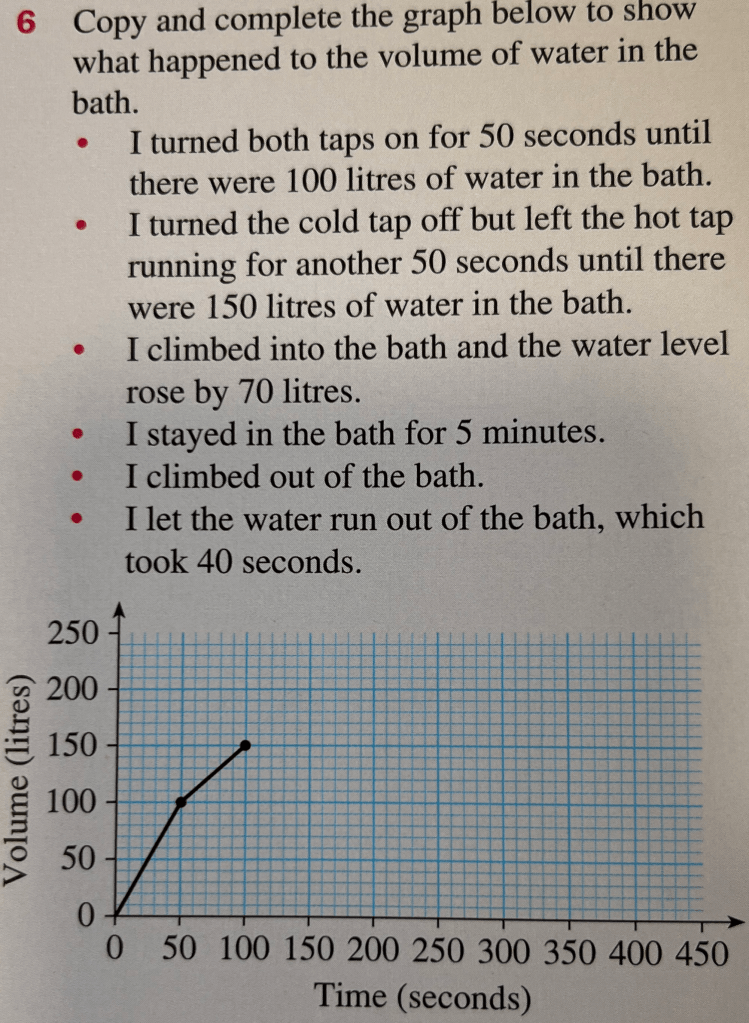
Exercise

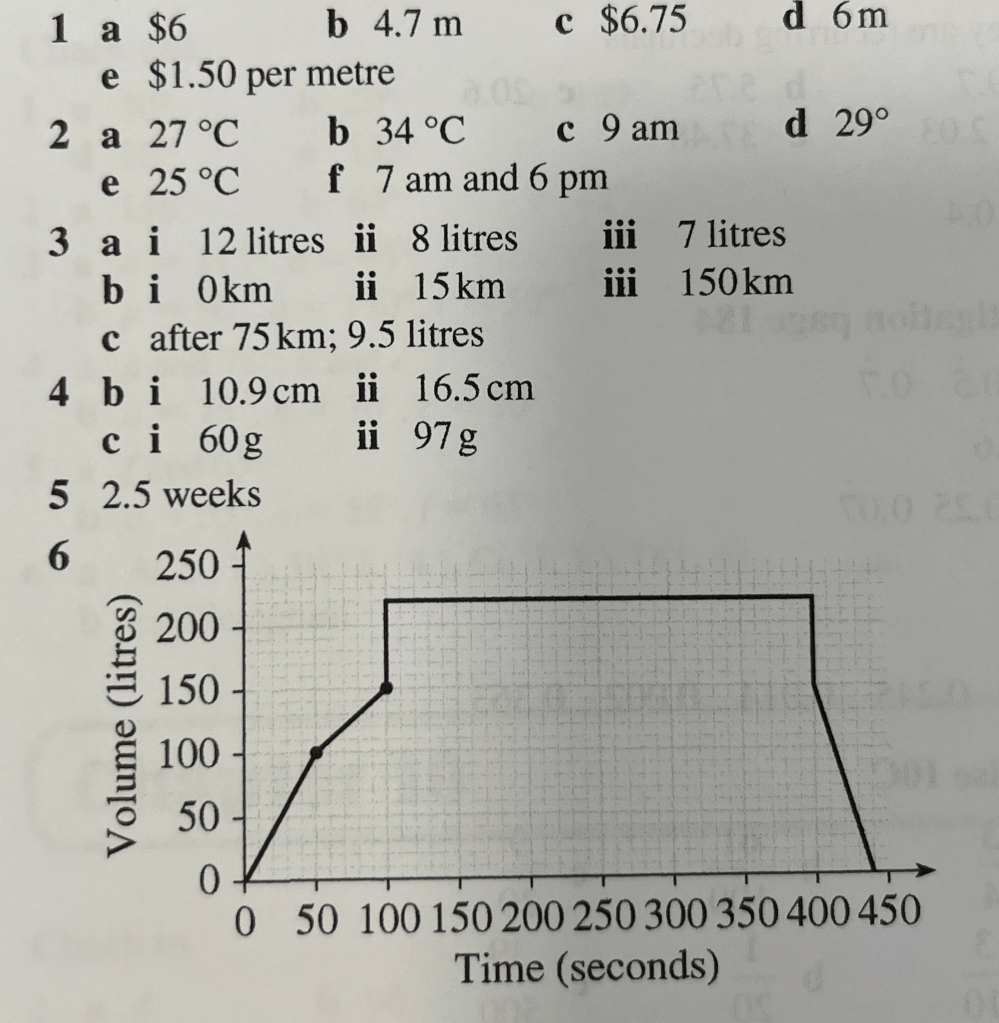
Answers