A pie chart is quite a popular way for newspapers and websites to present data. It is useful because it quickly shows the relative proportions represented by different categories.
Worked Example
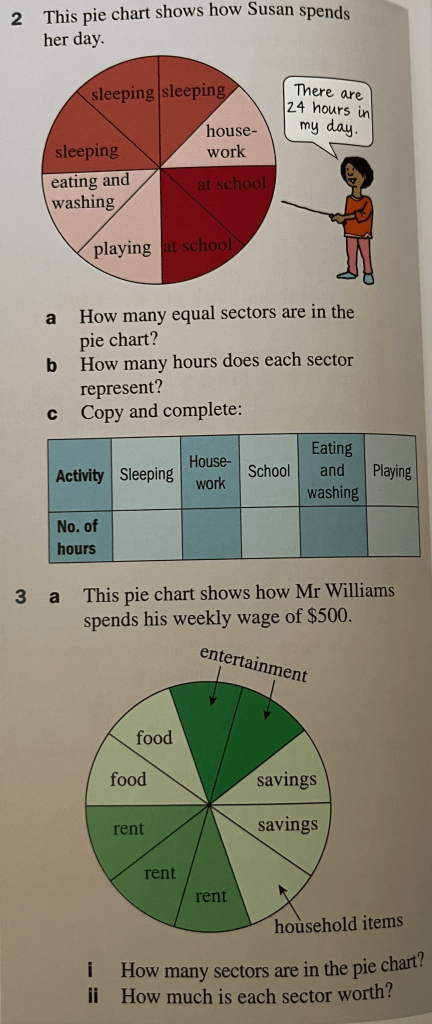
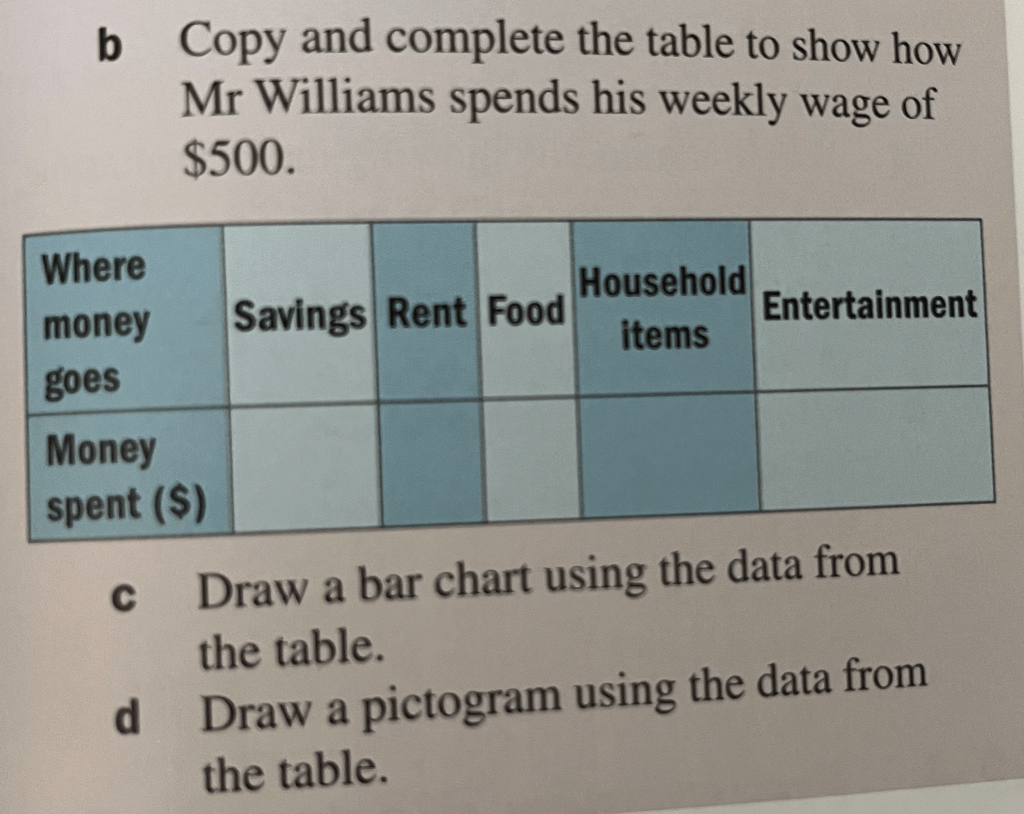
Your teacher will draw a pie chart showing how Masha spends her £12 of pocket money. Calculate how much she spends on each item and how much she saves.
Exercise 1

Drawing a pie chart
To draw a pie chart, we first need to calculate what angle is needed in each of the different categories’ sectors.
Then we can use a pair of compasses to draw a circle, mark a radius on it, then use a protractor to measure out the different angles from that radius.
Worked Example
Let’s practice this to draw a pie chart for the following information of how 80 students travel to school:
| Tranport | Walk | Bus | Car | Bicycle |
| Number of Students | 40 | 20 | 10 | 10 |
Exercise
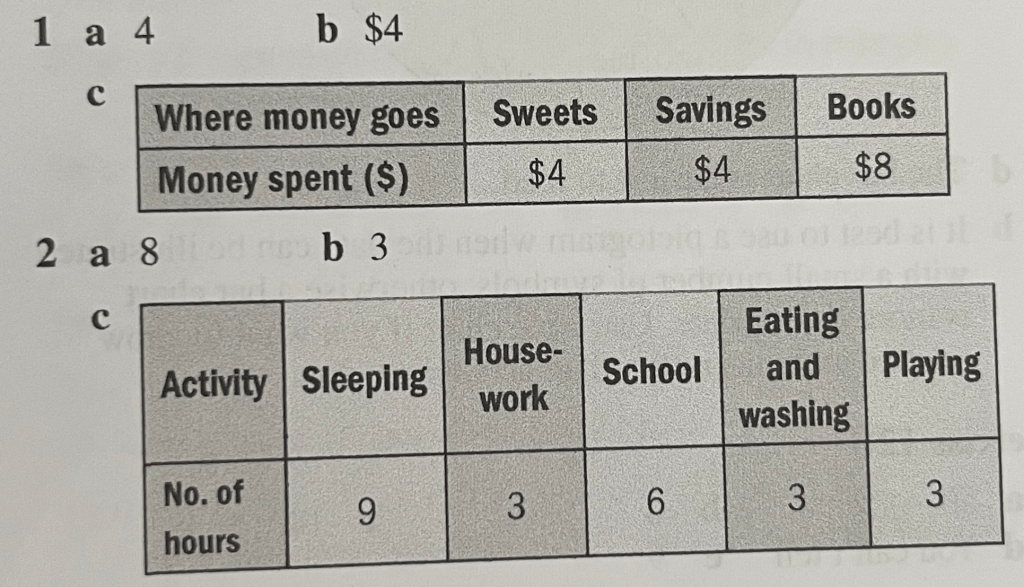
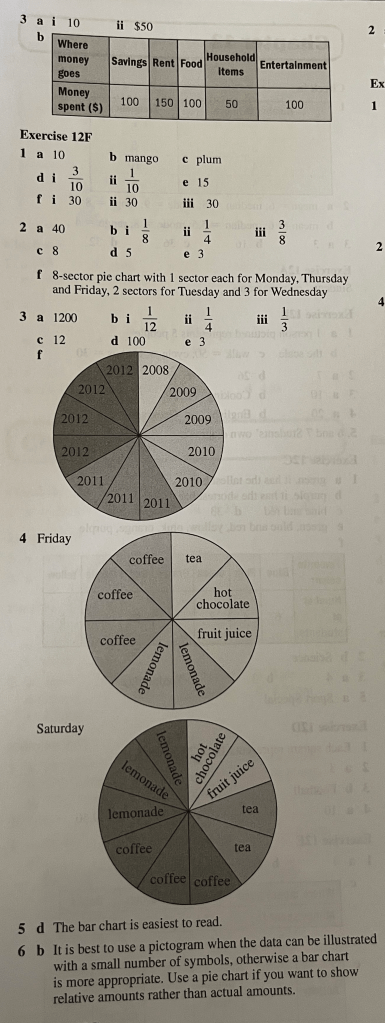
Answers