A pictogram is a very basic kind of graph that transforms a frequency chart into a graph, by using a simple picture to represent a certain number of items.
Let’s try making a pictogram to represent the number of students absent from school on each day of the week as per the following table:
| Day | Mon | Tues | Wed | Thurs | Fri |
| Number absent | 2 | 3 | 5 | 1 | 7 |
A picture can represent more that one item. Let’s apply this to the table below showing how many cupcakes were sold on a cafe on each day it was open. We will need to include a key.
| Day | Mon | Tues | Wed | Thurs | Fri | Sat |
| Cakes sold | 35 | 7 | 28 | 42 | 35 | 56 |
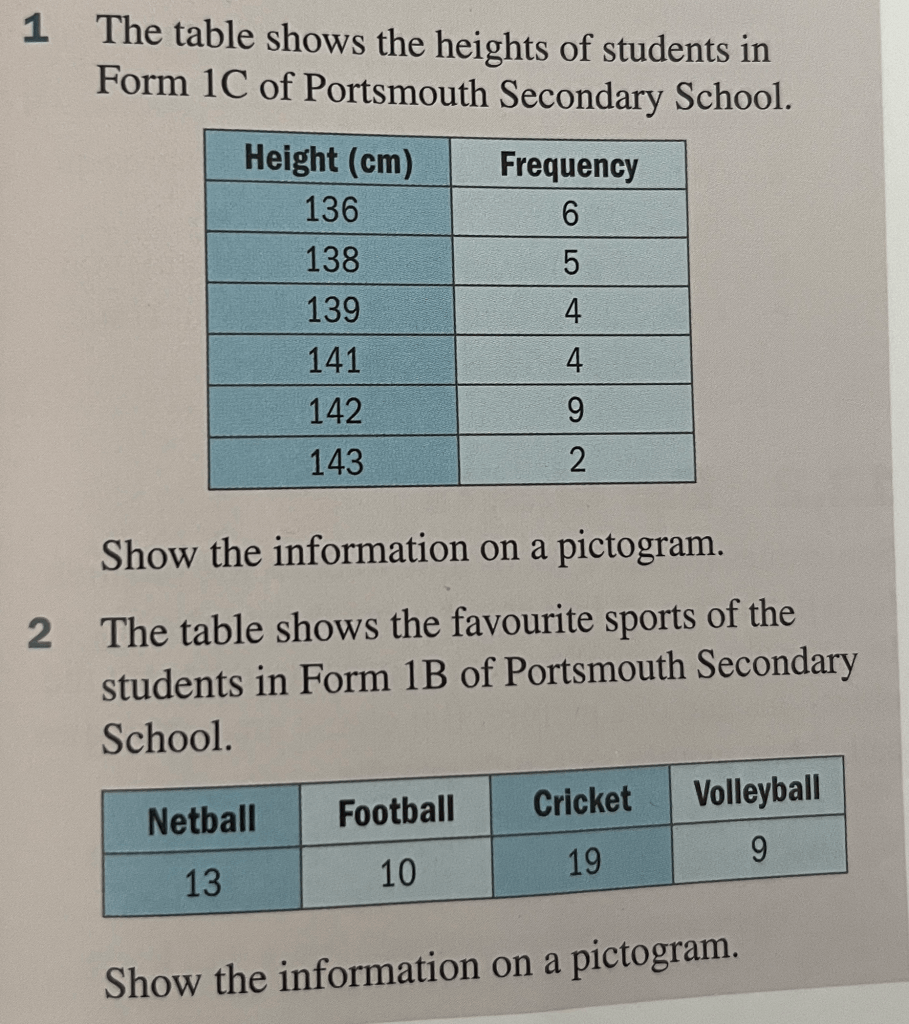
Exercise
Note that the question numbering repeats itself. Please don’t let this distress you!

Answers
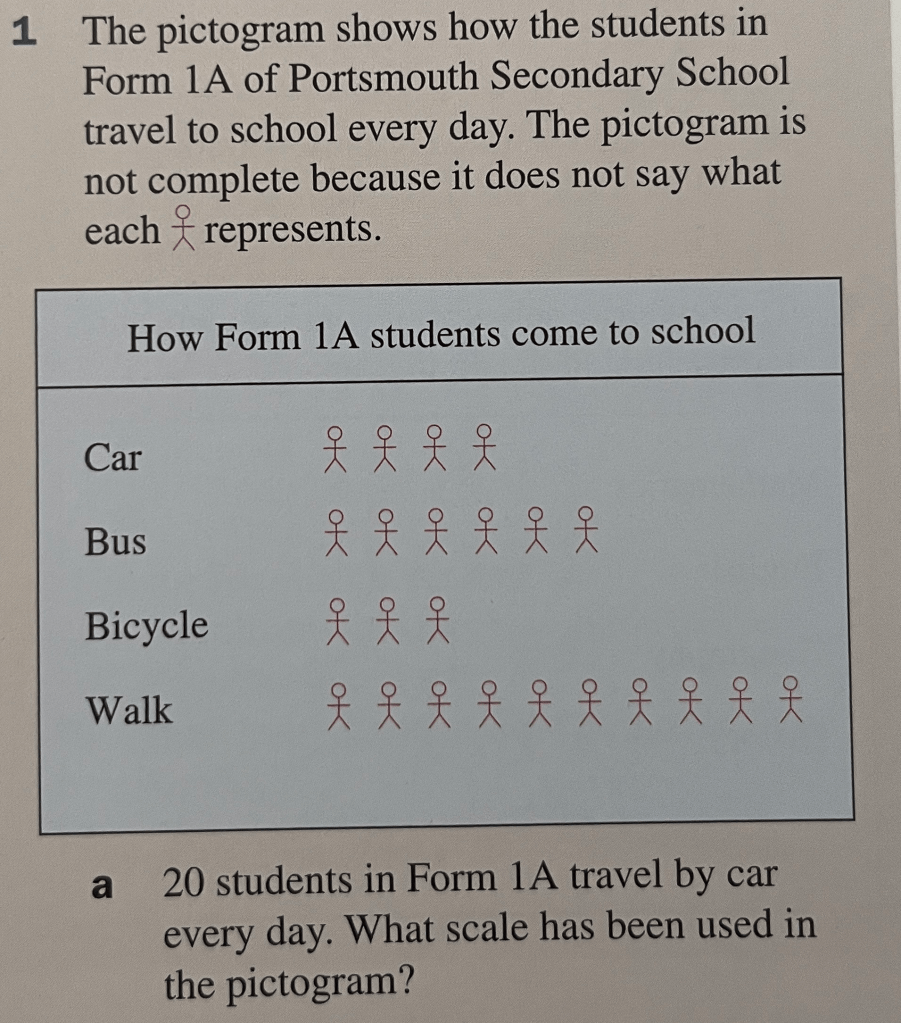
- (a) 1 person pictured represents 5 people; (b) the scale; (c) walk – 50, cycle = 50, bus = 30
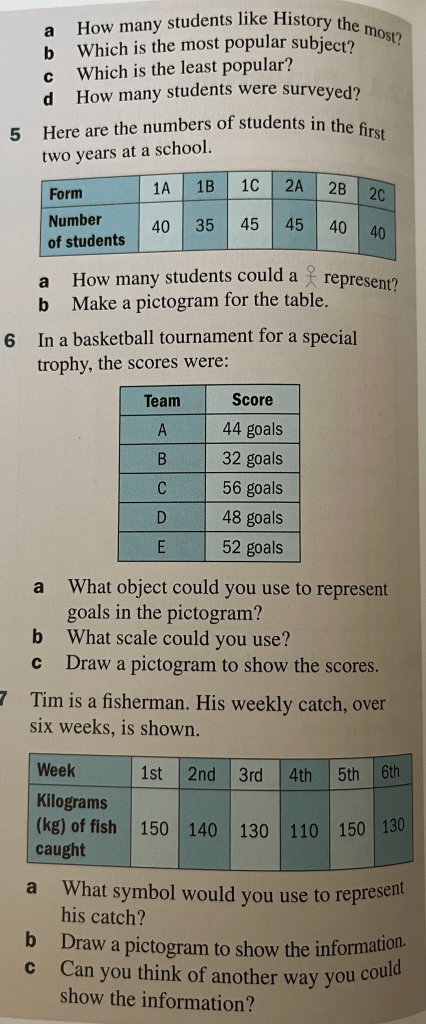
- (a) 7, (b) 26, (c) 2/13
- (a) 10, (b) cooking, (c) 32
- (a) 20, (b) English, (c) Geography, (d) 70
