Graphs and functions are closely related to each other.
We can compare the x-axis with the input to a function machine.
We can compare the y-axis with the output of a function machine.
Any function where every input has exactly one output can be called a linear function, and on a graph it will be represented by a line.
Worked Example
Draw the graph representing the linear function 2x +5 if the x-coordinate is the input and the y-coordinate is the output.
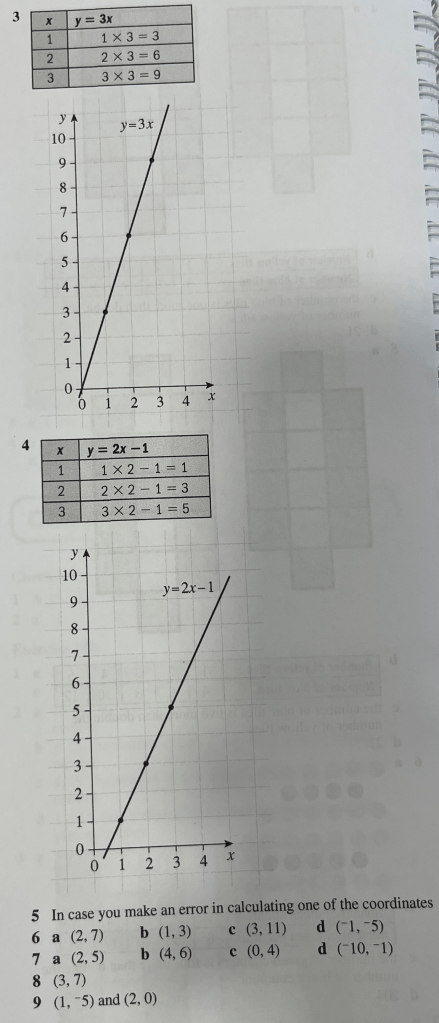
We can also write functions as linear equations. For instance, y = 4x – 1 means that we find the y-coordinate of each x-coordinate by multiplying it be four and then subtracting 1. Let’s find a few and think about what the line that represents this function would look like.
Worked Examples
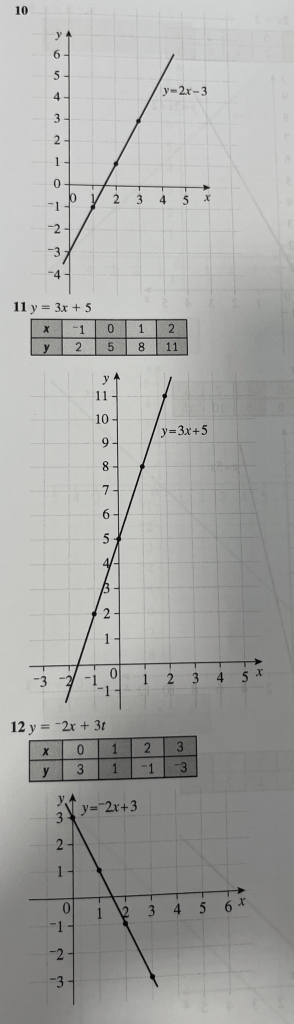
Draw the graph of y = x – 2
Draw the graph of y = 2x + 3
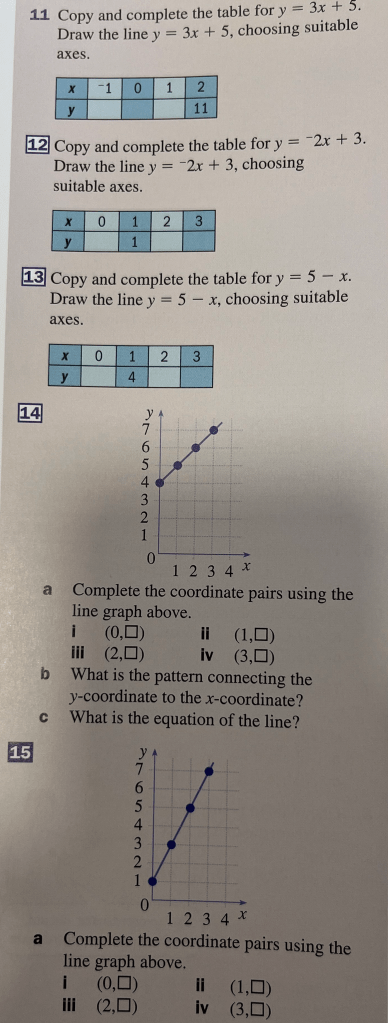
Exercise

Answers