If data is in a frequency table, we can calculate the mean in a quicker way than adding up all the data items together and then dividing them by the number of data values.
Let’s see how we do it with the frequency table below:
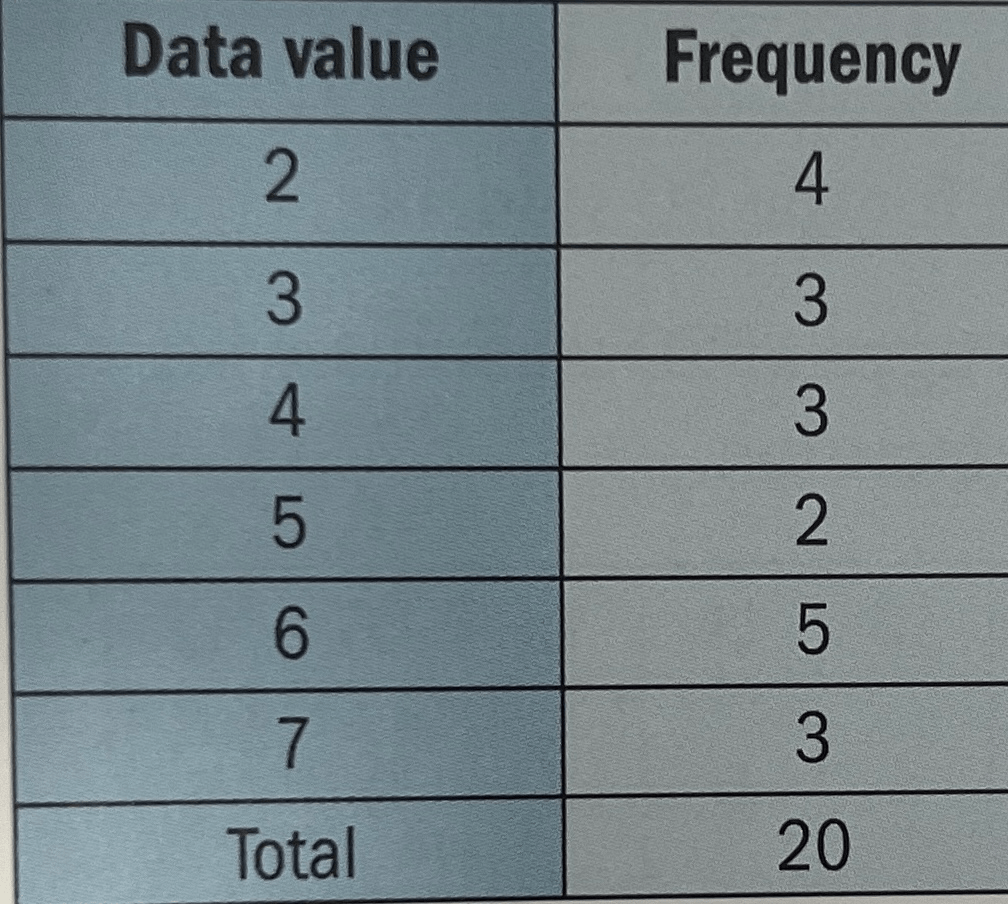
Exercise 1

Mode
Finding the modal class in a frequency table is simply a case of looking for the group with the highest frequency.
Worked Example

The above table shows the age of 50 people in a village. What is the modal class?
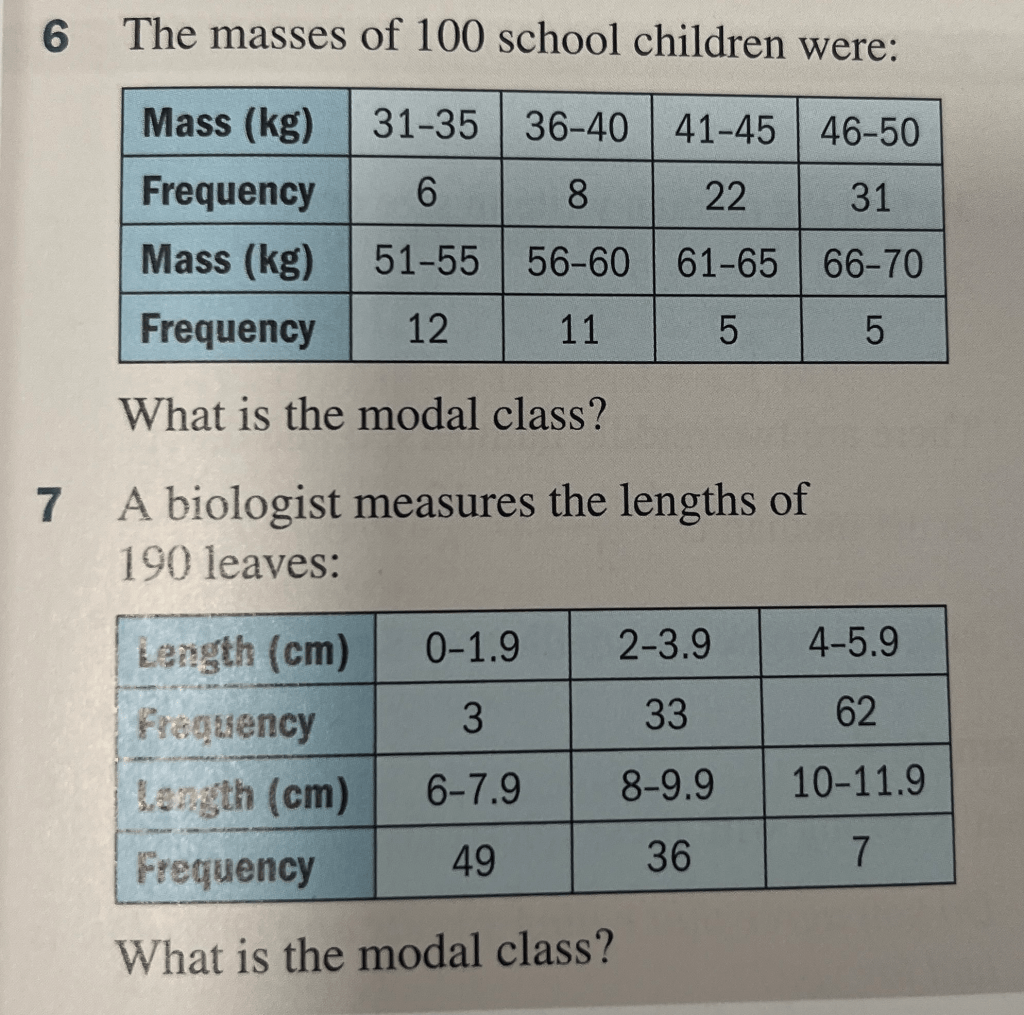
Exercise 2
(Where it says exercise 6G, it means exercise 1 above)

Answers to both exercises

