Primary data is data that we collect ourself, maybe by doing an experiment or asking people questions. Secondary data is data that we take from newspapers or the internet or any other situation where we don’t collect the data directly.
Data that falls neatly into categories, such as favourite food is called discrete data. (Data that doesn’t fall so neatly into categories is called continuous data – we’ll talk about that later).
When we are collecting data, we often use a tally chart to register the different items within a category (e.g. the different people that have brown eyes
Worked Example
Complete a tally chart for eye colour, assuming that you find 2 people with grey eyes, 9 people with green eyes, 15 people with blue eyes and 23 people with brown eyes.
We often find it useful to group data in order to notice meaningful patterns
Worked Example
Construct a grouped frequency table to gather the following data on the number of seconds different children can hold their breath underwater:
10. 24. 16. 37. 36. 32. 34. 21. 18. 26. 22. 35. 31. 31. 26. 16. 31. 11. 40. 13. 42
Be careful when grouping data to make sure that groups are unambiguous and don’t overlap.
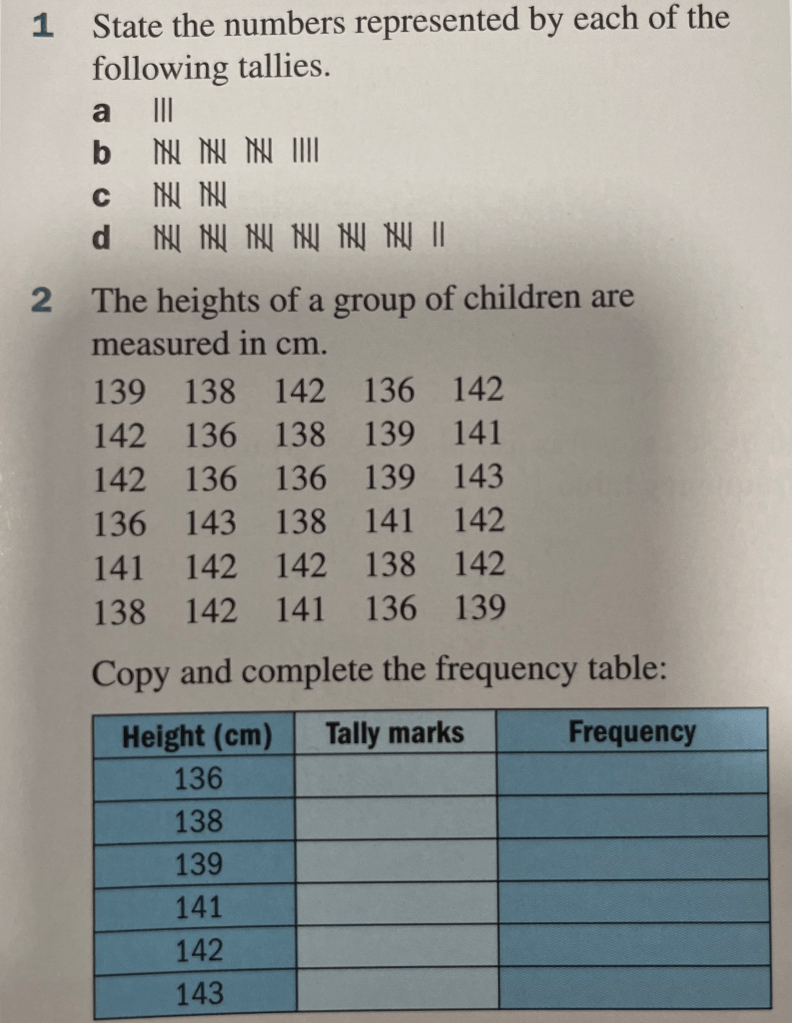
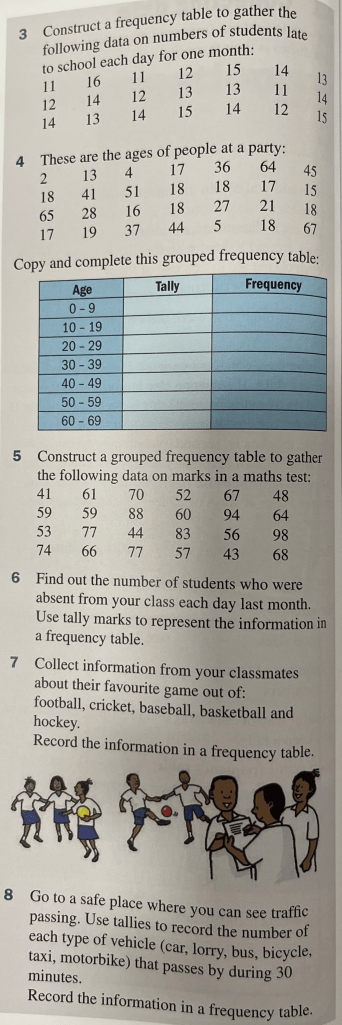
Exercise 1
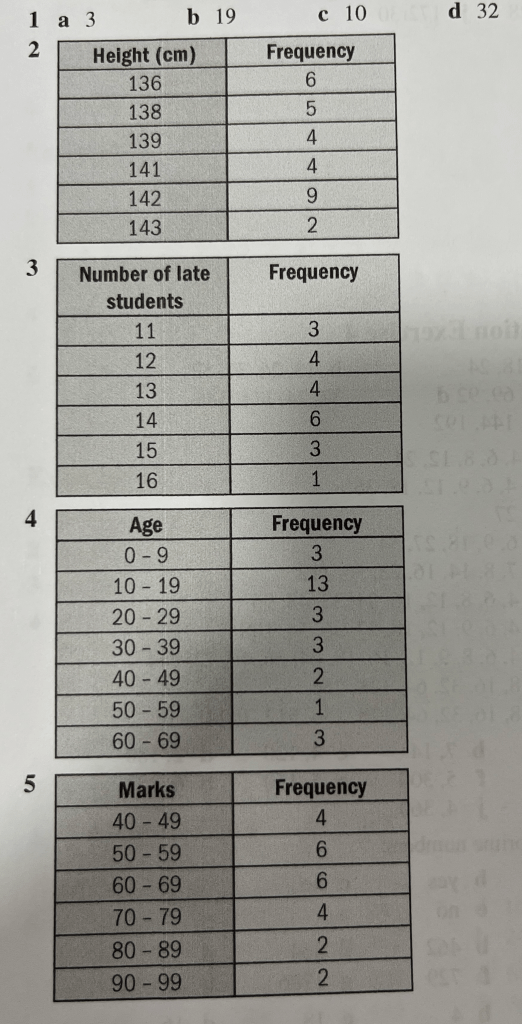
Answers