In previous years we have talked about the probability of event, which is the measure of how likely it is to happen on a scale from 0 to 1.
Often we will look at situations where there are several equally likely outcomes, like when we roll a dice (6 equally likely outcomes) or toss a coin (2 equally likely outcomes). In both of these examples, the outcomes are mutually exclusive – more than one can’t happen at the same time.
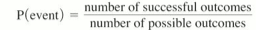
With equally likely and mutually exclusive outcomes, the probability of an event is calculated as follows:
In general, if we have more than one event, the probability of both events happening (i.e. the probability of one happening and the other happening) is calculated by multiplying the two probabilities together. The probability that either one or the other or both of the events will happen (in probability theory we call this the probability of one happening or the other happening) is calculated by adding the two probabilities together.
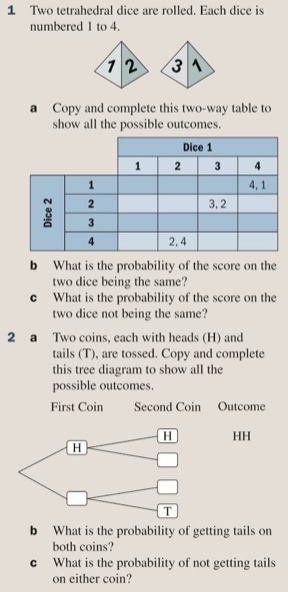
If we consider the outcomes of two different trials (e.g. tossing a coin and rolling a dice), a sample space diagram is very useful to list the sample space (that is all possible outcomes). Let’s try drawing one of these. We could also use a tree diagram (let’s try this too).
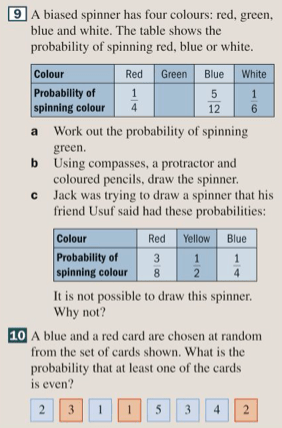
Exercise
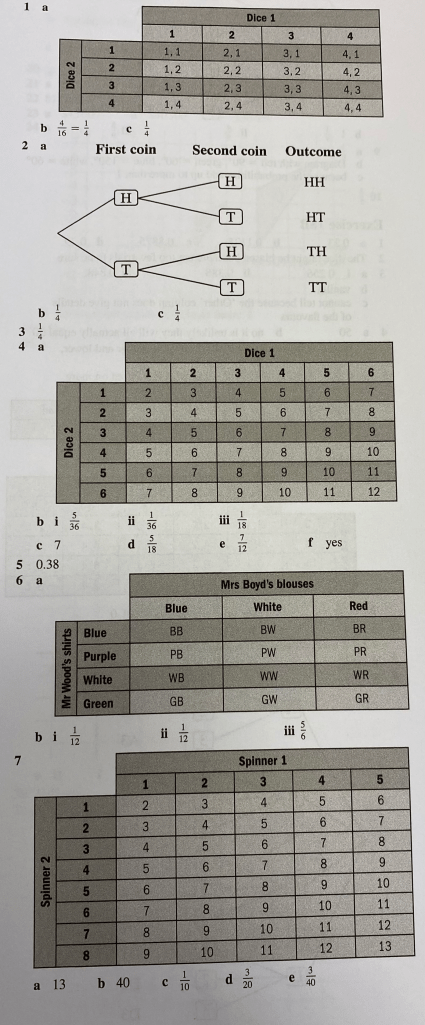
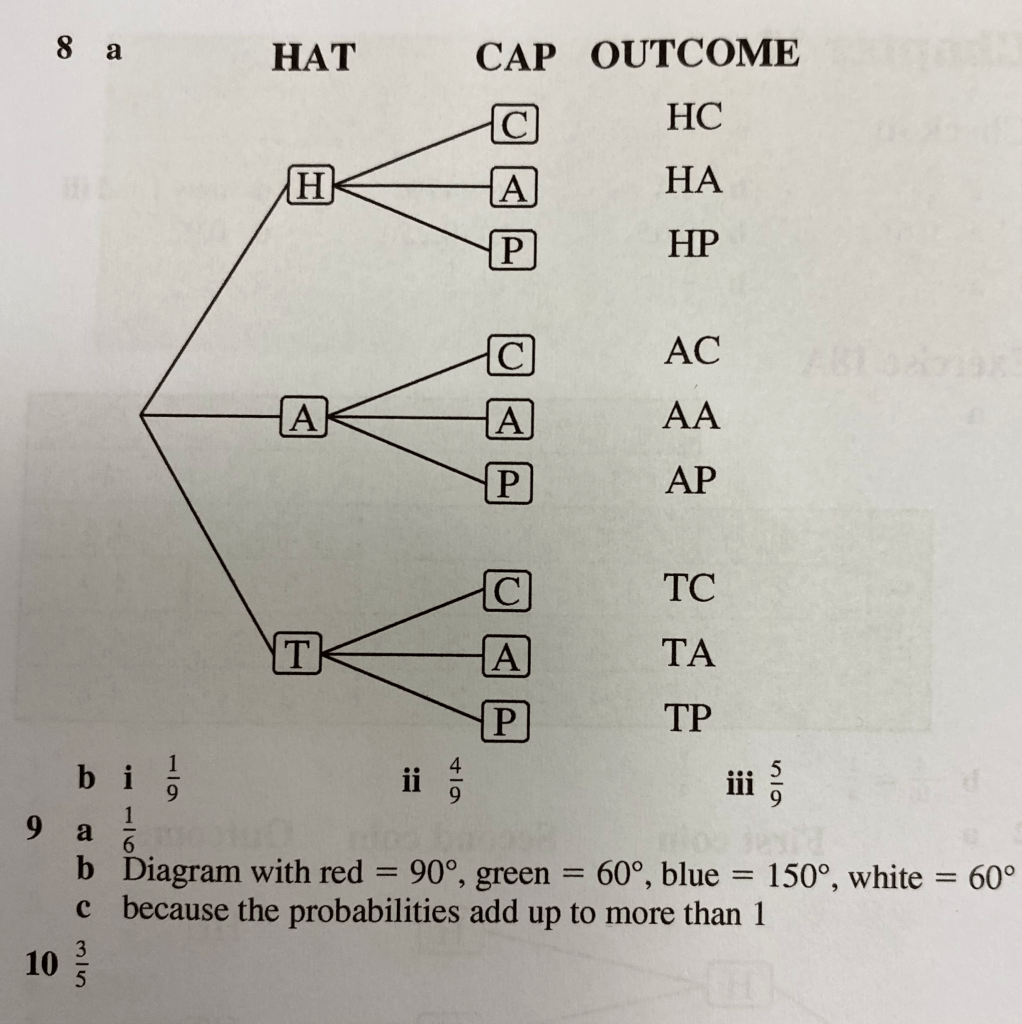
Let’s practice these in exercise 18A on pages 295 to 297 of the textbook:

The answers are below: