We should already be familiar with stem & leaf diagrams. Now let’s extend our use of these to include back-to-back stem & leaf diagrams. This is best understood by drawing one together and looking at its key features, so let’s do that for the following dataset, which shows the scores of two basketball teams over 20 games:

Using the diagram, let’s compare these two datasets. Remember that statistics are particularly useful for comparing datasets.
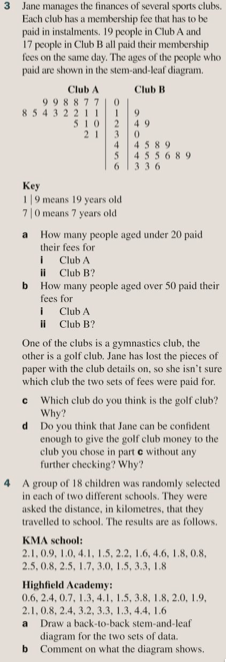
Exercise
Let’s complete exercise 12E on pages 185 and 186 of the textbook:

The answers are below: