Data can be qualitative or quantitative, and quantitative data can be discrete or continuous.
A good way of organising data is to put it into a frequency table, by listing the data in a column, adding a second column for a tally and a third column for a “count” of the frequency of the data. Let’s see this in the following example:
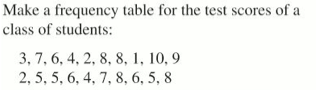
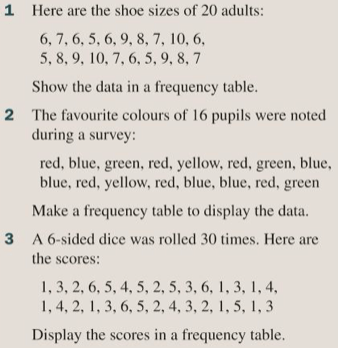
Exercise
Let’s practice organising data into frequency tables by completing exercise 6C from page 83 of the textbook:
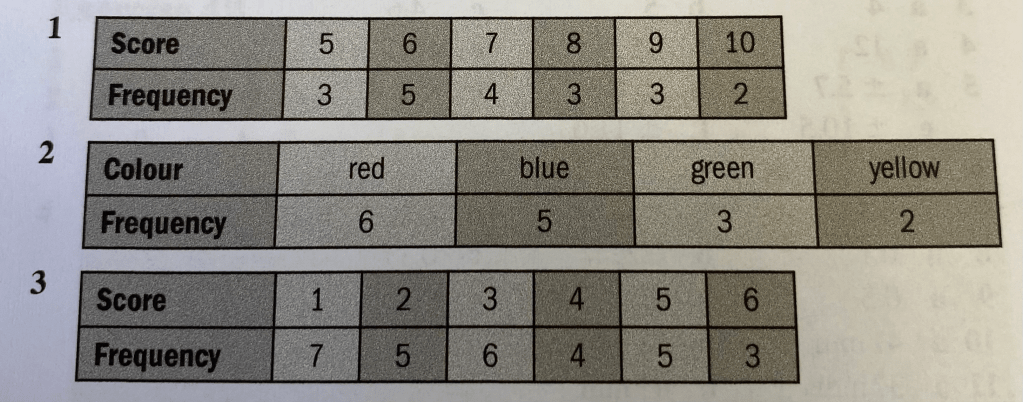
The answers are below:
Grouped Frequency Tables
With quantitative date, the table will often be too large, so instead of having each different category on a different row, we group the data into sensible groups. We can do this with discrete or continuous data and we normally aim to have around 5-10 groups (we choose the correct size of the class intervals to ensure this).
Example
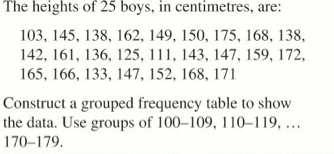
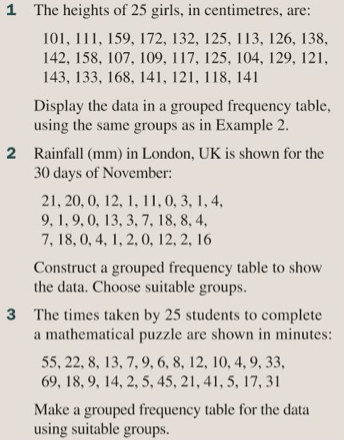
Exercise
Let’s complete exercise 6D from page 83 of the textbook:
The answers are below:

