A statistic is a single number that is used to represent a dataset.
The single most important statistic to represent a dataset is an average, which can also be called a measure of location or a measure of central tendency.
There are three averages that we will calculate – each of them we need to be able to calculate either for raw data or data compiled in a frequency table. The method is quite different in each case.
The second most important statistic we might calculate is a measure of dispersion or measure of spread. At this stage the only such measure we will consider is the range, which is simply the largest value in the data set minus the smallest value in the dataset.
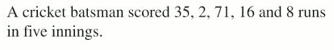
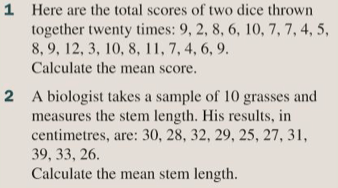
Let’s find each of our three different averages and the range for the following raw data:
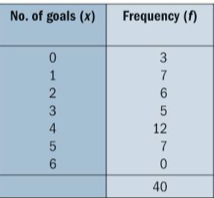
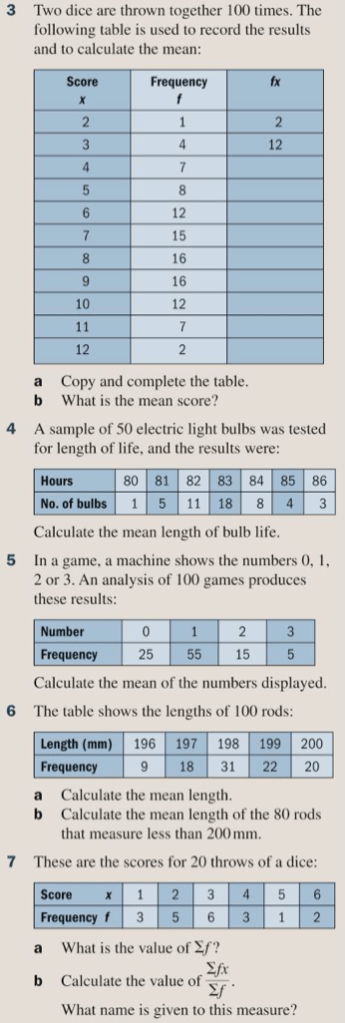
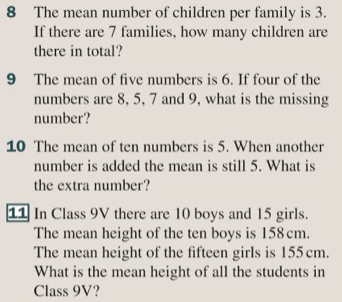
Now let’s find each of our three different averages and the range for the following data compiled in a frequency table:
Exercise
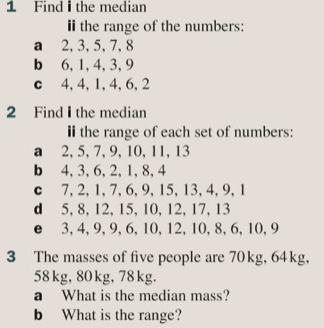
Let’s complete all of exercise 6E, questions 1 and 3 of exercise 6G and all of exercise 6H. These questions are on pages 84 to 88 of the textbook:
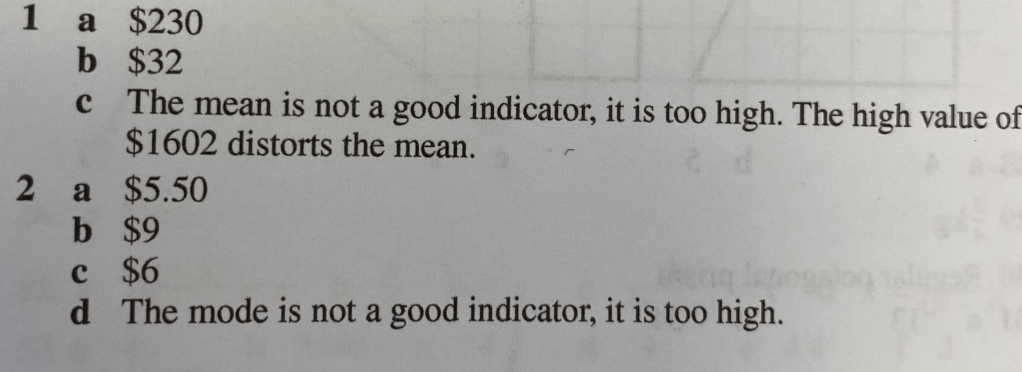
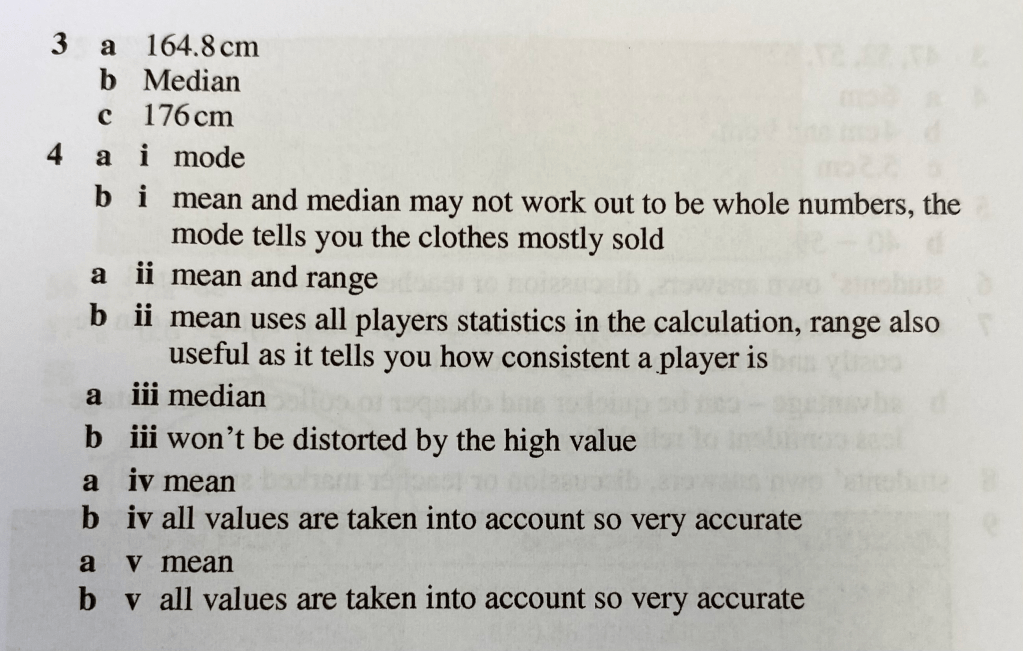
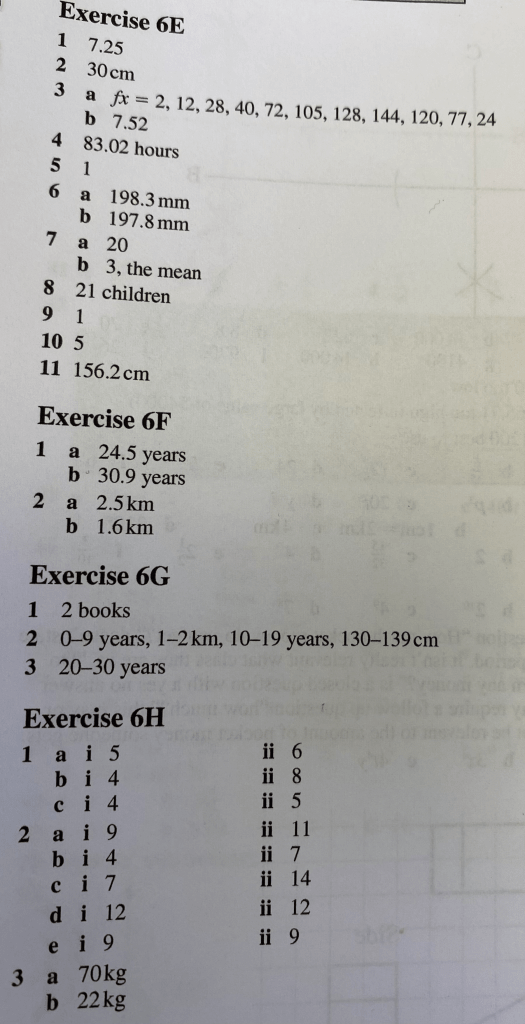
The answers are below:
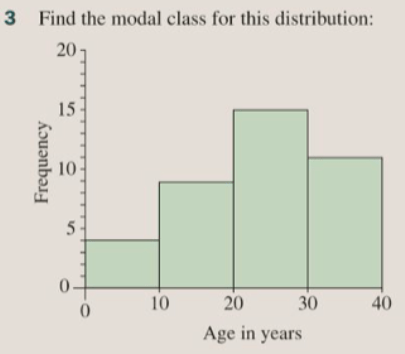
Choosing between averages
Typically the mean is the best average as it takes into account the value of every data entry in the dataset. It can be considerably skewed by outliers however, so if there exist outliers we will often choose the median instead, even though this does not consider all data entries. The mode is not often useful, but it can be useful for a shopkeeper, for instance deciding which size of shoe to order. This is why it is sometimes called the shopkeeper’s average.
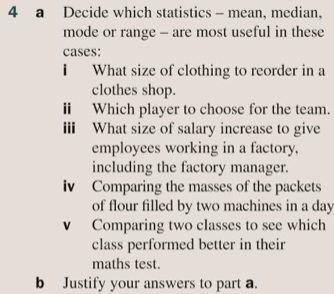
Exercise
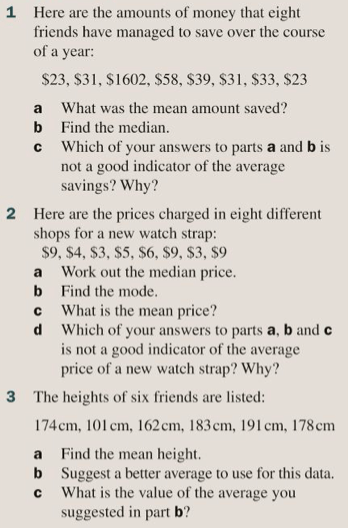
Let’s consider the usefulness of each of the different averages by completing exercise 6I from page 88 of the textbook:
The answers are below: