Let us start by reminding ourselves how to plot points on a set of Cartesian axes. We can open Desmos or Geogebra for an example of axes.
To draw a graph of a quadratic equation we need to substitute in various values of x to find their corresponding values of y. Then each pair of values (x,y) gives us a point on the curve which the quadratic equation represents. The shape of the curve of a quadratic equation will always be a parabola.
Let’s try plotting the curve for the quadratic equation y=3x2-4x+1
Exercise
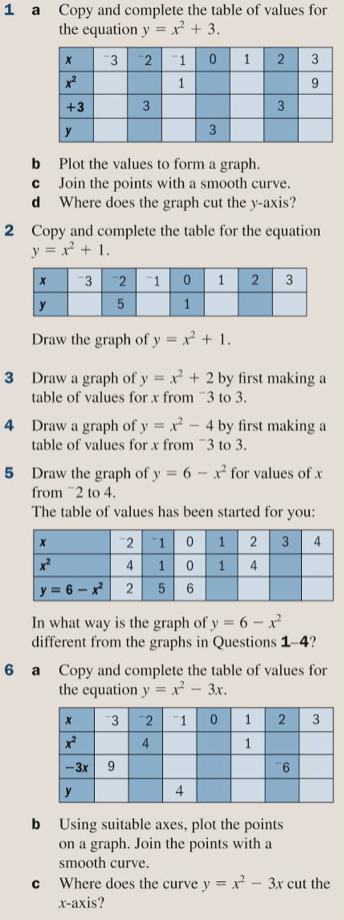
Let’s complete exercise 19A on page 309 of the textbook:
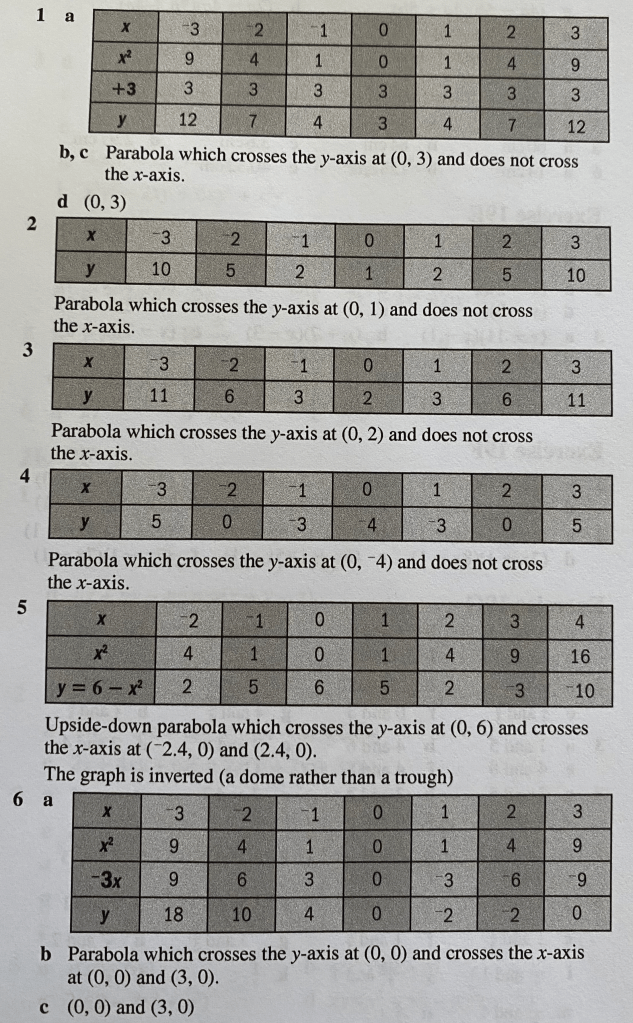
The answers are below: