Scatter graphs are different from all of the other graphs we look at, because instead of displaying the frequency of different categories or values they compare two different attributes. This is why this kind of graph is part of a topic called bi-variate analysis (i.e. analysis of 2 variables).
To draw a scatter graph we represent one variable on the x-axis and the other variable on the y-axis. Each item of data is represented by a specific point on the graph.
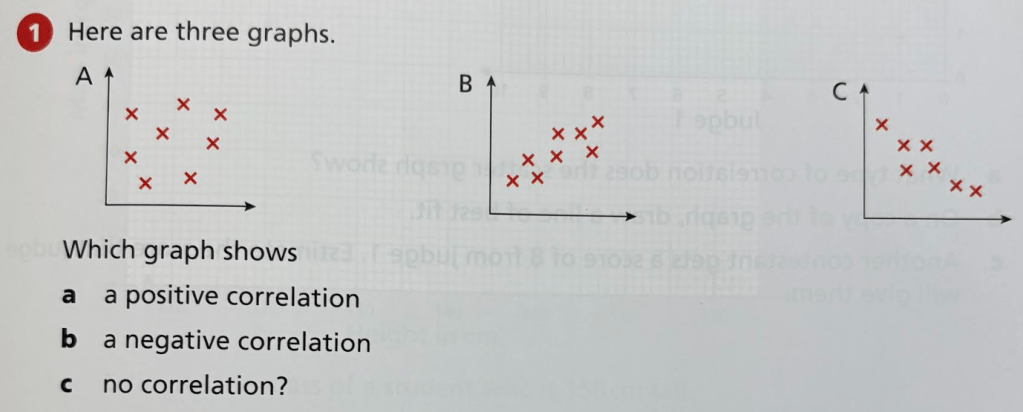
We can identify certain relationships between the two variables by identifying a pattern on our graph, namely a positive correlation, a negative correlation, or no correlation.
Worked Example 1
Below is a scatter graph comparing temperature and the number of ice creams sold in a park:
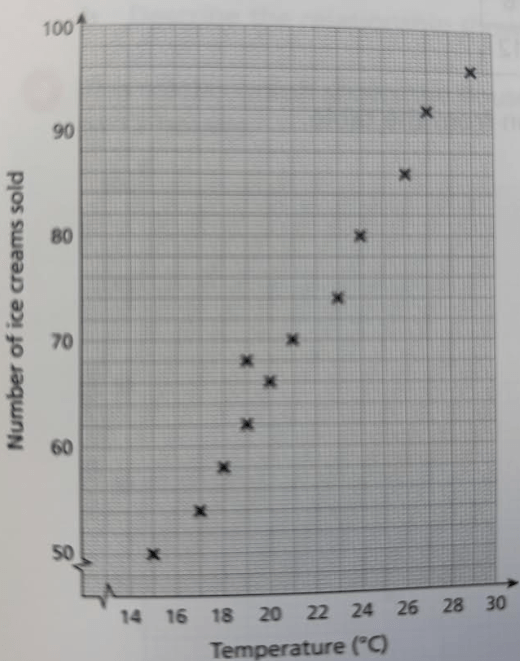
(a) When the temperature was 22 degrees Celsius, 78 ice creams were sold and when the temperature was 25 degrees Celcius, 77 ice creams were sold. Include this information on the graph.
(b) Describe the relationship between the temperature and the number of ice creams sold.
Worked Example 2
The scatter graph below shows the height and arm span of 10 people:
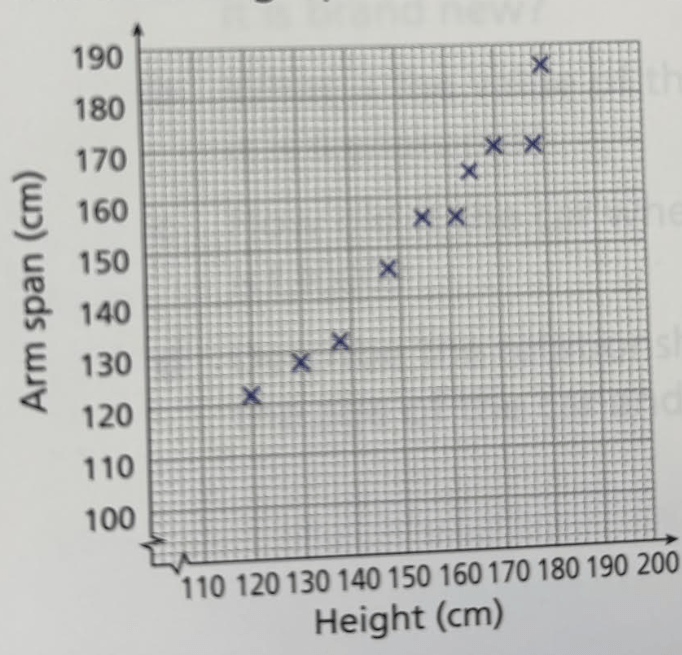
(a.) Describe the correlation;
(b.) Draw a line of best fit;
(c.) Estimate the arm span of a person who is 145cm tall.
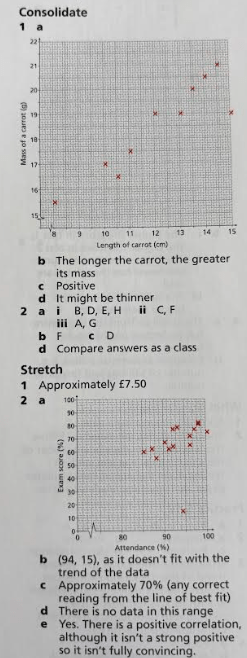
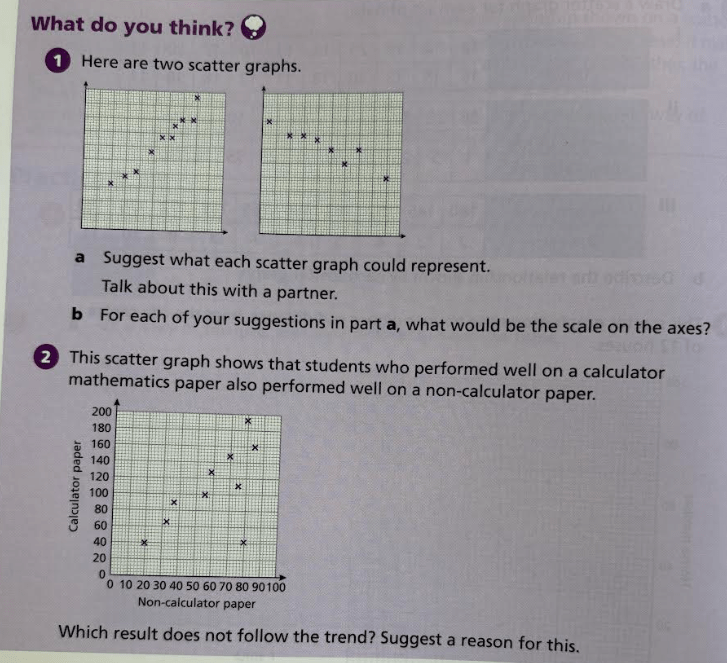
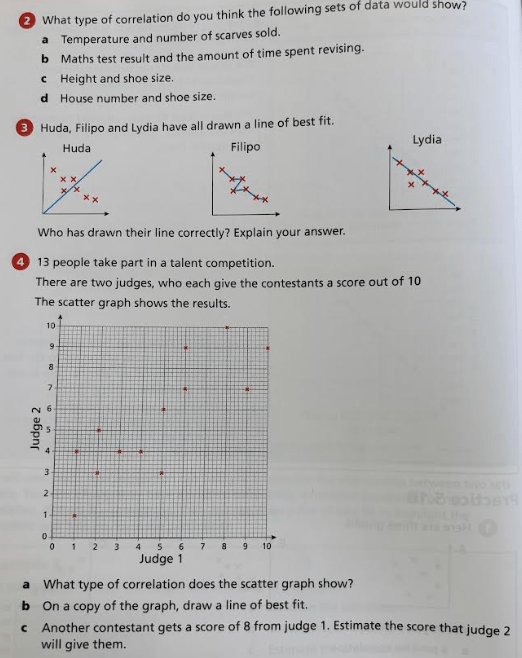
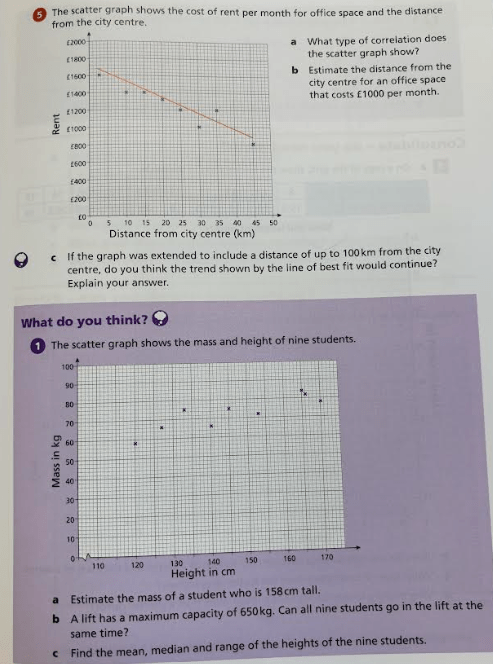
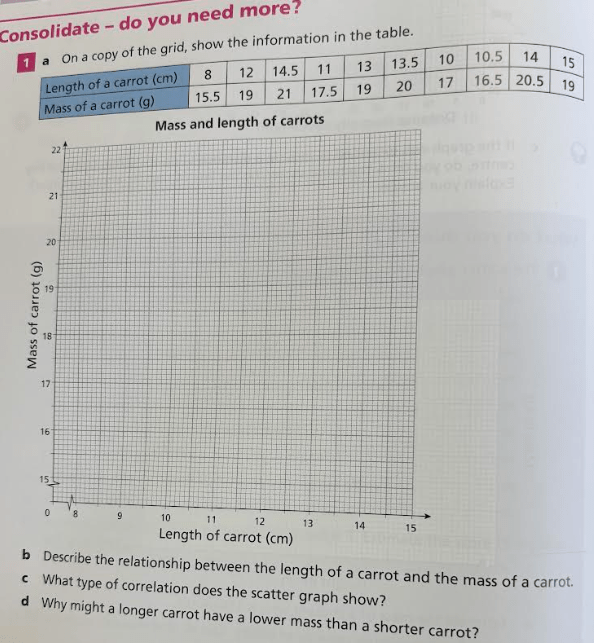
Exercise 1

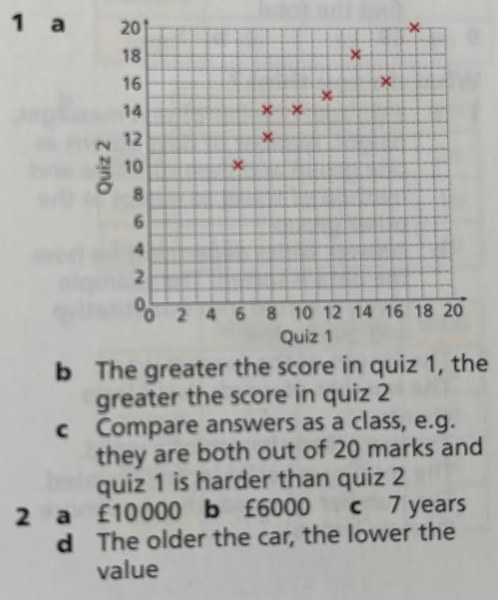
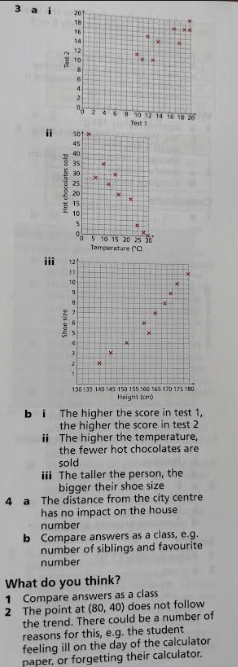
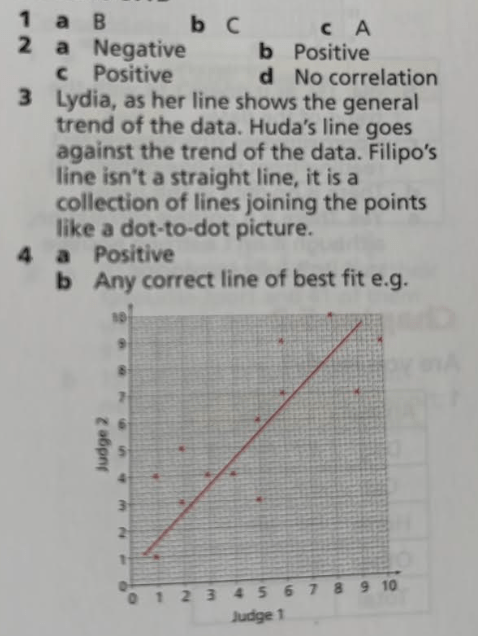
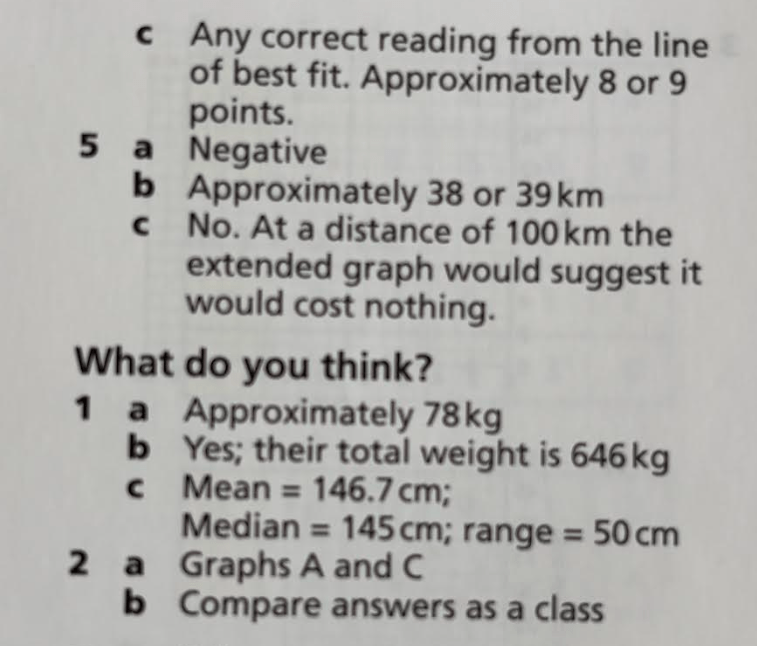
Exercise 1. Answers
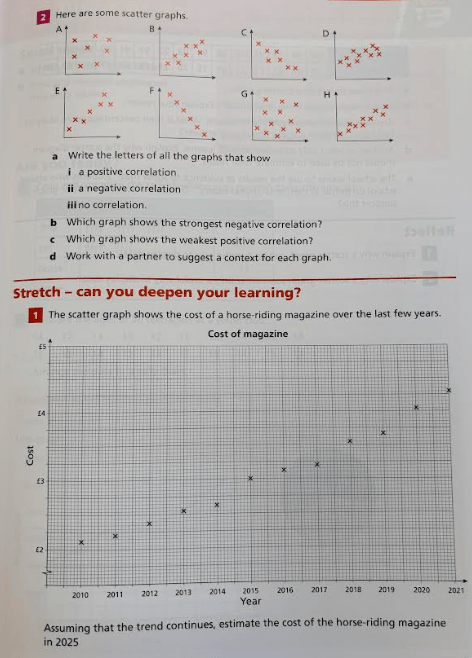
Exercise 2
Exercise 2. Answers
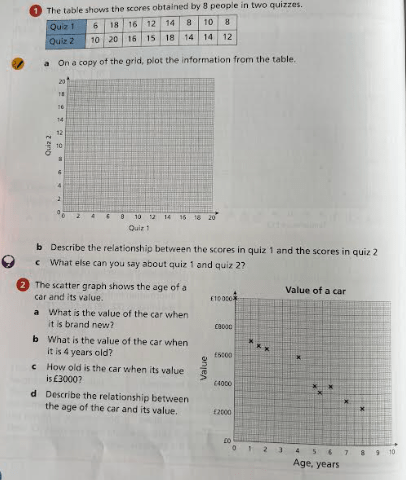
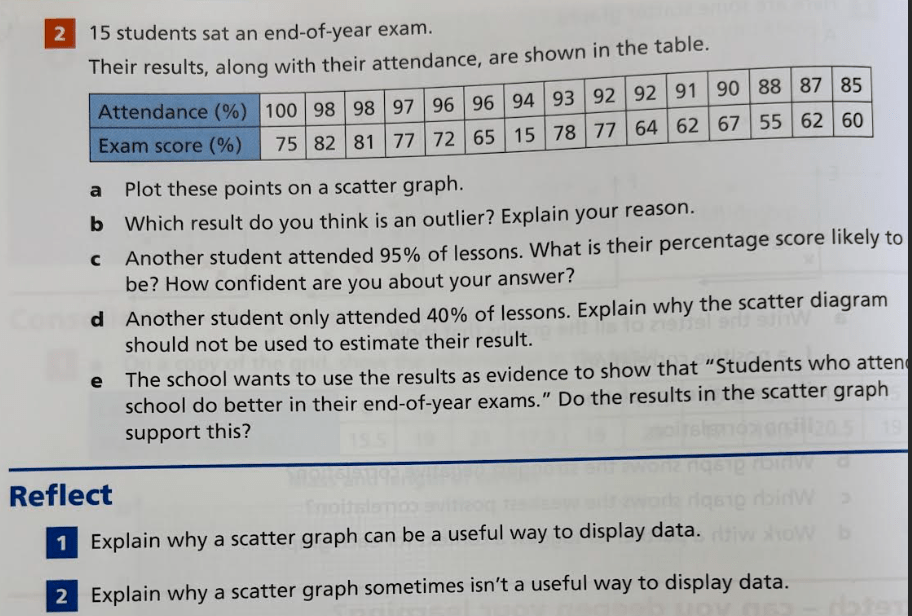
Exercise 3
Exercise 3. Answers