So how about if you were allowed to use two numbers and not just one to represent a set of data? What would the second number be?
- We consider 3 different measures of spread:
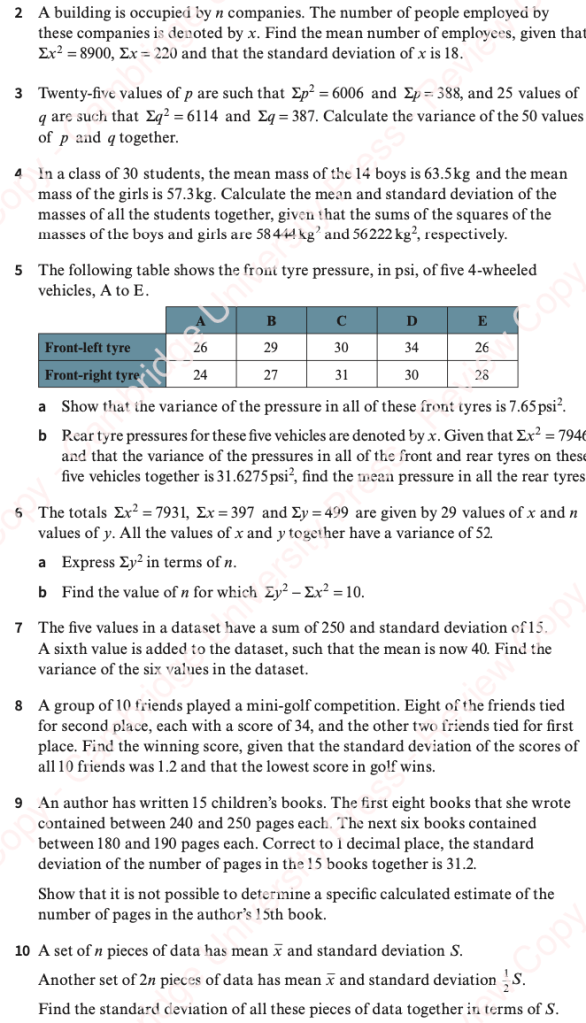
- Range;
- Interquartile Range;
- Standard Deviation.
Range
Range = Largest value – Smallest value
Simplest measure of spread
Ignores the pattern of the spread (e.g. 1,9,9,9,10 and 1,1,1,1,10 have the same range)
Interquartile Range
IQR = Q3-Q1, where Q1 is the lower quartile and Q3 is the upper quartile
Quartiles are the ‘quarter way’ values (like the median is the ‘halfway’ value)
Finding quartiles:
If there are an even number of data values, Q1 is the median of the lower half of the data and Q3 is the median of the upper half of the data;
If there are an odd number of data values, remove the median and take the median of the lower half and proceed as above.
Worked Examples

Finding Interquartile Range from tables or graphs
For frequency tables, apply the same process as with the median, measuring the cumulative frequency to find the class, and using interpolation based on the proportion through the class if it is necessary to estimate a specific value;
For cumulative frequency graphs, process is easy. Draw a line from the quarter way points on the y-axis and read off the values on the x-axis.
Five Number Summaries and Box & Whisker Plots
These are quick and useful ways to summarise the 5 most important numbers that represent a data set, i.e. the minimum value, the lower quartile, the median, the upper quartile and the maximum value
They are also very useful for quickly comparing 2 datasets.
Worked Example – Draw a Box Plot for the following data
Identifying “skew” from Box Plots

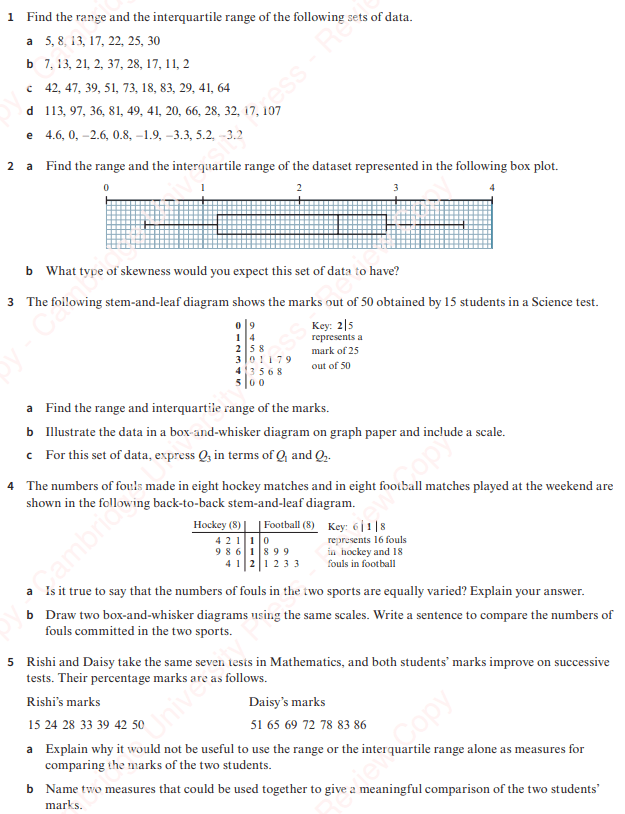
Exercise 1


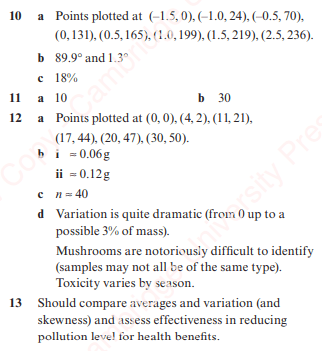
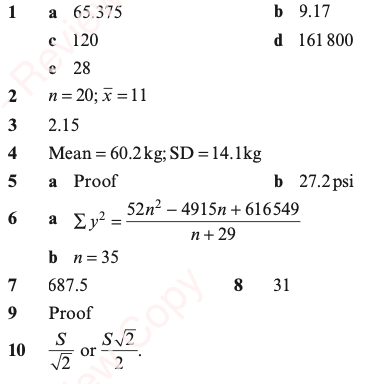
Answers

Variance & Standard Deviation
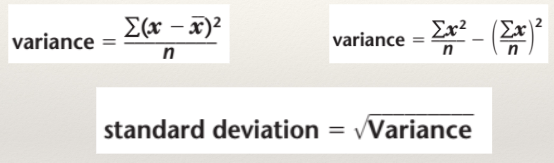
The formula on the left is easiest to understand, but the formula on the right is easiest to calculate, so we will generally be using that.
Deriving the formula on the right from the one on the left is off syllabus, but is a good home exercise for those who are interested.
Note that the values need to be squared to stop them from all cancelling out and giving always a variance of zero.
This is why we use the square root of variance as our measure, so that the units are the same as the individual data values.
The standard deviation is an excellent measure of dispersion, but can be significantly affected by outliers.
Worked Examples
Example 1: Six masses were weighed as 4, 6, 6, 7, 9 and 10 kg. Find the mean, variance and standard deviation of these weights.
Example 2:
The marks scored in a test by seven randomly selected students are: 3 4 6 2 8 8 5
Find the variance of the marks of these seven students.
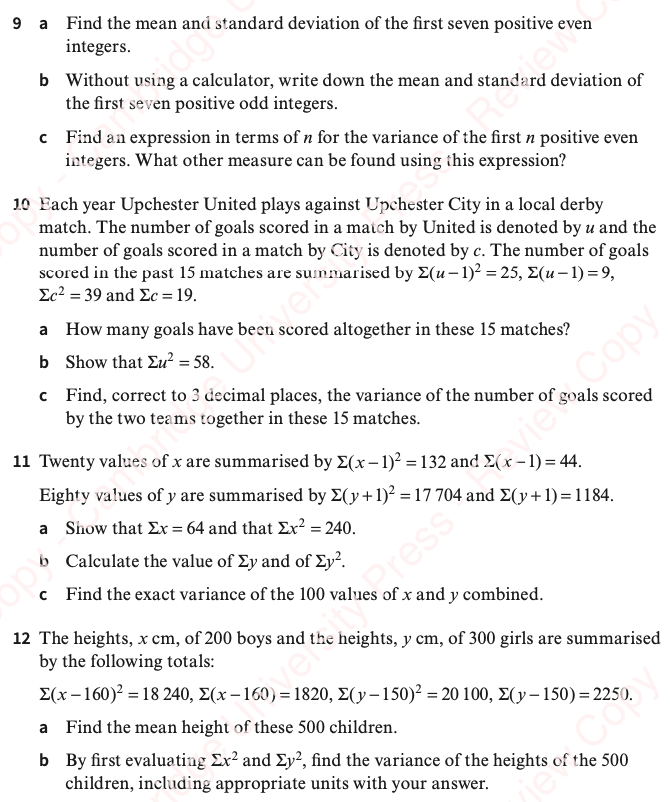
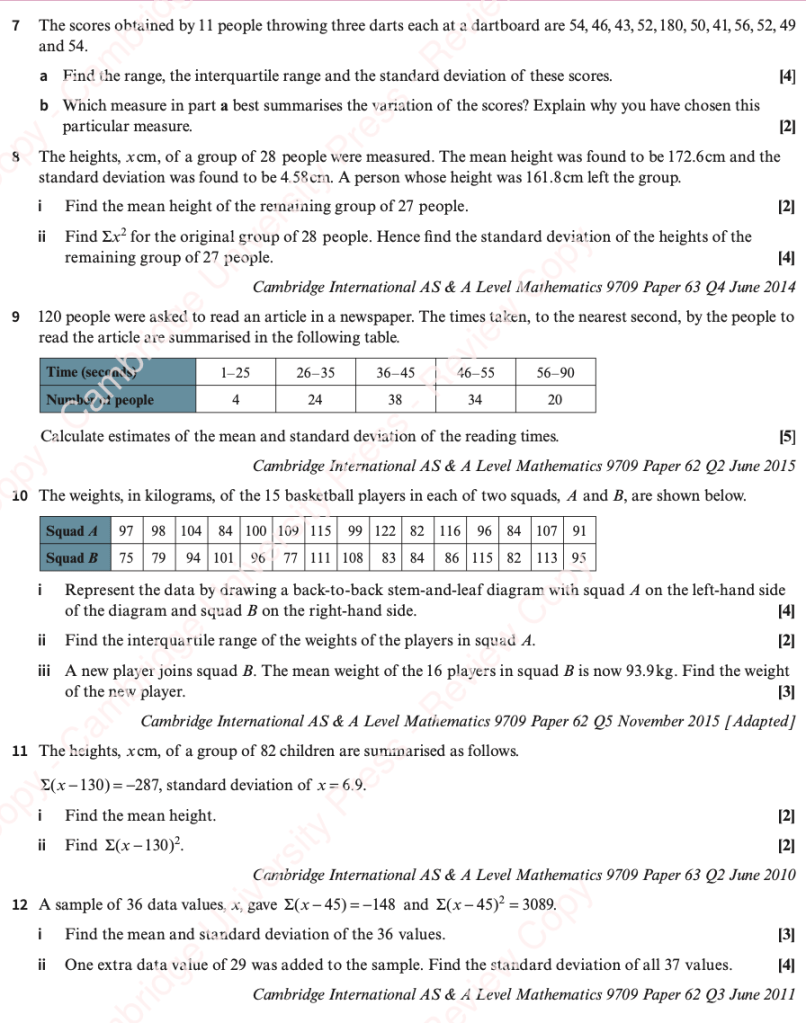
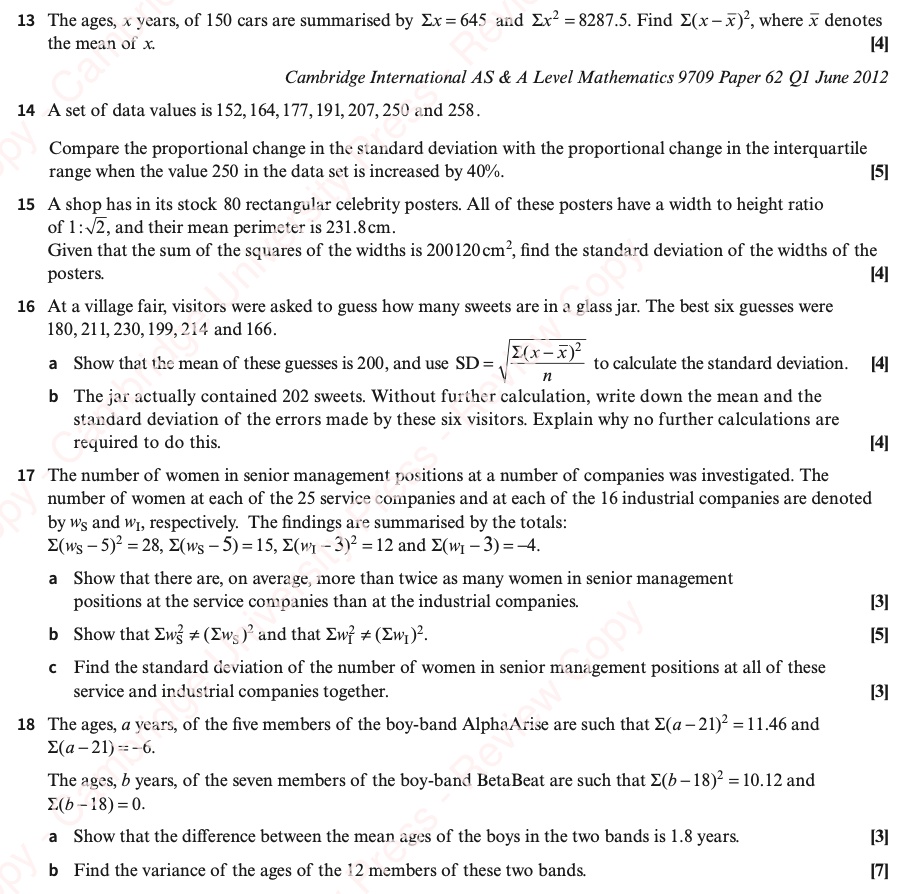
Variance and Standard Deviation from a Frequency Table

Worked Examples
Example 1: Find the standard deviation of the values of x given in the following table, correct to 3 significant figures.
| x | f |
| 12 | 13 |
| 14 | 28 |
| 16 | 10 |
Example 2 (Grouped): Calculate an estimate of the standard deviation of the heights of the 20 children given in the following table:
| Height (metres) | 1.2- | 1.4- | 1.5-1.7 |
| Number of children (f) | 2 | 12 | 6 |
Exercise 2


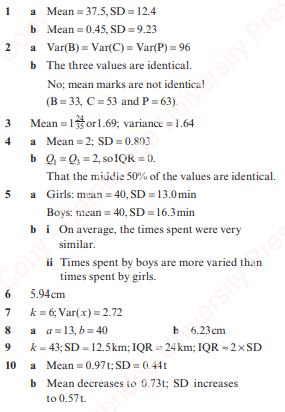
Answers
Combined Sets of Data
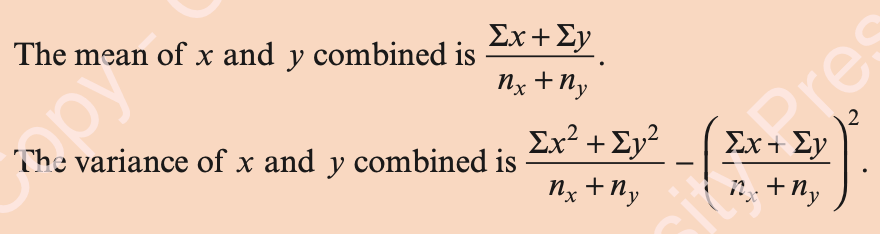
We can’t find the variance of two datasets simply by adding the variances together and dividing them by 2.
As when we were calculating the mean of two datasets, we need to multiply up to find the other values in the formula first and then use these on the combined dataset.
Worked Example: Combining Sets of Data
The number of errors, x, on each of 200 pages of typing was monitored. The summary of the results showed that 

(a) Calculate the mean and the standard deviation of the number of errors per page.
(b) A further 50 pages were monitored and it was found that the mean was 4.4 errors and the standard deviation was 2.2 errors. Find the mean and the standard deviation of the number of errors per page for the 250 pages.
Worked Solution
In general, for a combined set of numbers, the mean is 

Worked Example 2
The heights, x cm, of 10 boys are summarised by Σx = 1650 and Σx2 = 275 490.
The heights, ycm, of 15 girls are summarised by Σy = 2370 and Σy2 = 377835.
Calculate, to 3 significant figures, the standard deviation of the heights of all 25 children together.
NOTE
Worked Example 3
In an examination, the percentage marks of the 120 boys are denoted by x, and the percentage marks of the 80 girls are denoted by y.
The marks are summarised by the totals Σx = 7020, Σx2 = 424 320 and Σy2 = 352 130. Calculate the girls’ mean mark, given that the standard deviation for all these students is 10.
Exercise 3

Answers
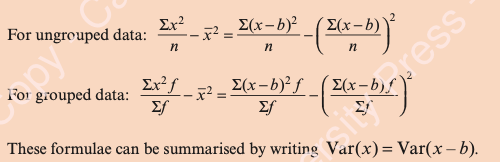
Coded Data
Adding a constant to all values in the data set translates the dataset, but leaves the variance unchanged, so: var(x)=var(x-b) (whereas 
You can use the formulae shown below, but again, in practice we solve problems by multiplying up to give the ∑x and ∑x2 values that we require to use with the combined dataset.
Formulae
Worked Example
Sweets are packed into bags and sold with a label saying the bag has weight 75g.
Ten bags are picked at random from the production line and weighed. Their masses in grams are:
76 74.2 75.1 73.7 72 74.3 75.4 74 73.1 72.8
1.) Use your calculator (properly 😉 ) to find the mean mass and the standard deviation.
2.) It was later discovered that the scales were reading 3.2g below the correct weight. What was the correct mean mass of the ten bags and the correct standard deviation?
3.) Compare your answers to parts (1.) and (2.) above and comment.
In general, if each number is increased by a constant, k, the mean is therefore increase by k, but the standard deviation remains unaltered.
Worked Example 2
Salt is packed in bags which the manufacturer claims contains 25kg.
Eighty bags are examined and the mass, x kg, of each is found. The results are 

Find the mean and standard deviation of the masses.
Worked Example 3
Eight values of x are summarised by the totals Σ(x − 10)2 = 1490 and Σ(x − 10) = 100. Twelve values of y are summarised by the totals Σ( y + 5)2 = 5139 and Σ( y + 5) = 234. Find the variance of the 20 values of x and y together.
Worked Example 4
It is known that 20 girls each have at least one brother. The number of brothers that they have is denoted by x. Information about the values of x – 1 is given in the following table.
| x-1 | 0 | 1 | 2 | 3 | 4 |
| Number of girls (f) | 2 | 4 | 8 | 5 | 1 |
Use the coded values to calculate the standard deviation of the number of brothers, to 3 decimal places.
Exercise 4

Mixed Exercise

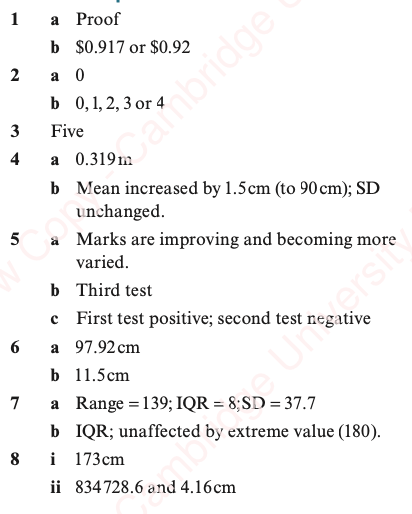
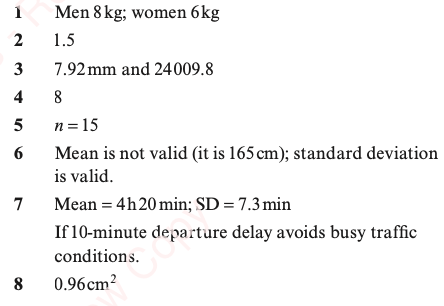
Answers to Exercise

Answers to Mixed Exercise