If you had to represent a data set by a single number, which number would you use?:
Measures of Location – Mean
Most common measure of location.
Sum of the values in the dataset divided by the number of values.

Worked Example
Calculate the mean for the following data:
| Worker | A | B | C | D | E | F | G | H | I | J |
| Time (minutes) | 7 | 12 | 10 | 8 | 6 | 8 | 5 | 26 | 11 | 9 |
Calculating the mean from a frequency table
Add an extra column ‘xf’ for the product of the frequency and the data value (if the data is in classes, x will be the midpoint of the class).
Total this column and then use the below formula:

Worked Example – Mean from Frequency Table
Estimate the mean using the data in the following table:
| Length of pine cone (mm) | 30-31 | 32-33 | 34-36 | 37-39 |
| Frequency | 2 | 25 | 30 | 13 |
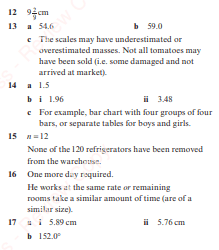
Exercise 1


Answers

Coding
This method that can be used to make calculation of mean easier if numbers are large. For instance, if we code numbers using the formula 


Worked Example
A scientist measures the temperature x°C at five different points in a nuclear reactor and gets the following results: 332°C, 355°C, 306°C, 317°C, and 340°C.
Use the coding 

Note
Because 


So, for instance, if 

Exercise 2
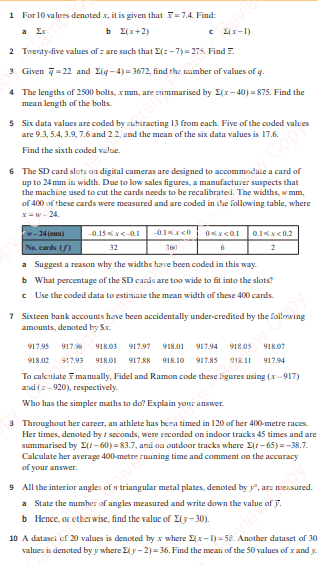

Answers

Measures of Location – Median
Order the values in order of increasing size.
If there are n values and n is odd, then the median is the 


The median is used when average salary is published in the newspapers.
Worked Examples:
Find the median of 30, 26, 32, 29, 31, 27, 30, 27, 27, 32, 27, 30, 31, 31, and 30;
Find the median of 90, 95, 91, 93, 91, 93, 91, 93, 92, 93, 92, 92.
Finding the median from a frequency table
Add a ‘cumulative frequency’ column.
Use the above described measures. This will give you the class, but not the exact value (grouping loses information). We can estimate the exact value using interpolation, but this goes beyond the S1 course requirements:
| Length of slow worms (mm) | Frequency |
| 125-139 | 4 |
| 140-154 | 4 |
| 155-169 | 2 |
| 170-184 | 7 |
| 185-199 | 20 |
| 200-214 | 24 |
| 215-229 | 10 |
Finding the median from a cumulative frequency graph
Use a cumulative frequency graph and read off the x-value that corresponds to the y-value half-way up.

Summary comparison of measures of location and skew:
The mode is the value that occurs with the highest frequency
A data set can have more than one mode (e.g. bi-modal) or no mode at all
The modal class is the class with the highest frequency density
We sometimes call the mode the shopkeepers’ average. Why?
The median is not susceptible to outliers. The mean is.
Negative skewed data is data with a tail on the left-hand side (i.e. a large number of large values)
Positive skewed data is data with a tail on the right-hand side (i.e. a large number of small values
A distribution with a tail of low values on the left (i.e. negatively skewed data) will have a mean which is greater than the median (thinking about salaries helps in understanding why this is so).
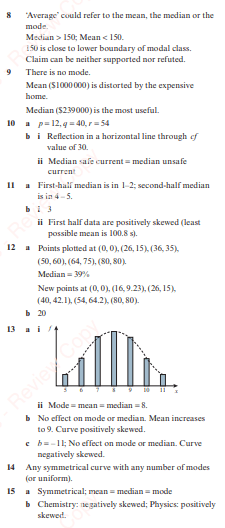
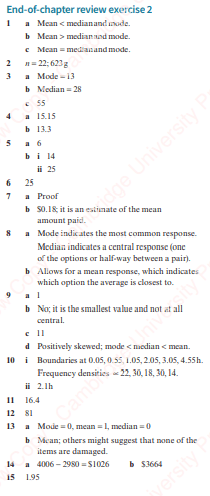
Exercise 3 and Mixed Exercise


Answers