When we talk about measures of location, we are talking about averages, because the average of a data set is effectively a single number that tells us where the data set is located. Measures of spread tell us about how widely the data set is dispersed. These two numbers are the most important statistics in summarising a data set.
There are three averages and one measure of spread that we already know:
1.) The mode: This is the piece of data, or value, that occurs the most frequently;
2.) The median: This is the piece of data, or value, that is in the middle if we line all of the data up in order. If there is no value in the middle we take the value that is halfway between the two middle values;
3.) The (arithmetic) mean: This is the value that we get if we sum the values and then divide our answer by the number of values.
4.) The range: This is.a measure of spread, calculated by subtracting the smallest number from the largest number.
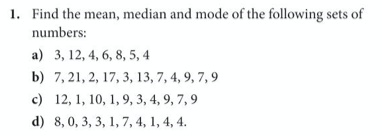
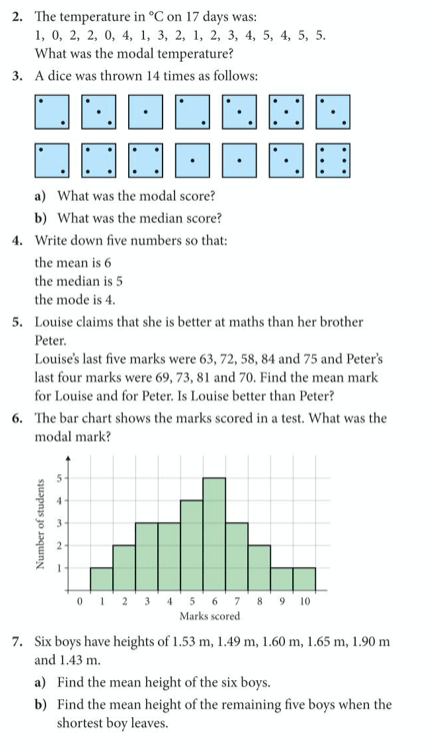
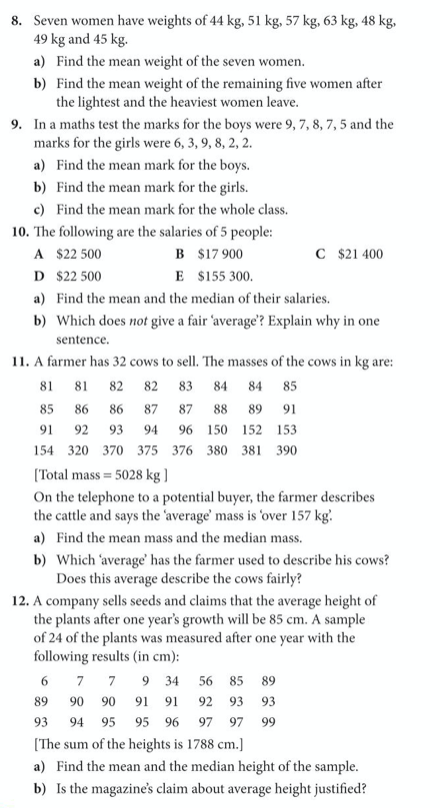
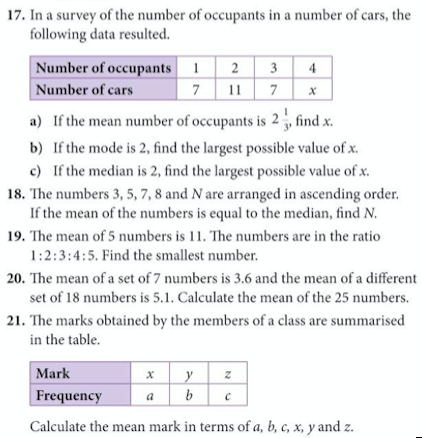
Let’s do a short exercise to remind ourselves of these averages (exercise 11 on pages 166-168 of the core textbook):
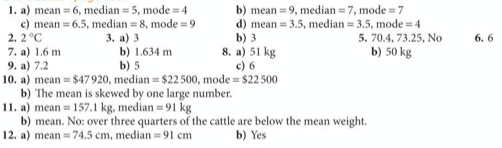
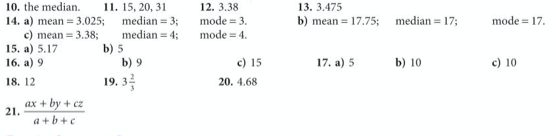
The solutions are as follows:
Extension work
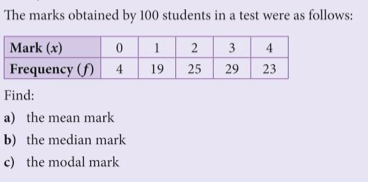
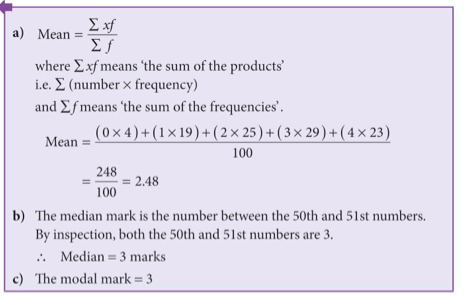
If data is given in the form of a frequency table, we can calculate the mean average using the formula mean = Σfx / Σf, where Σf means the sum of all the frequencies, and Σfx means the sum of the products of the values with the frequencies. Below is an example of this process:
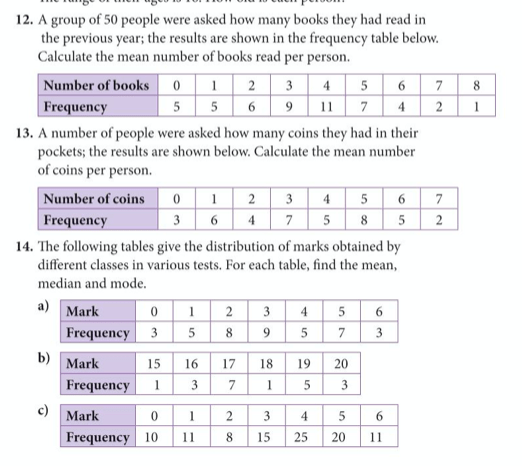
Try the questions below from exercise 5 on pages 346 to 347 of the extended textbook:
The answers are as follows:
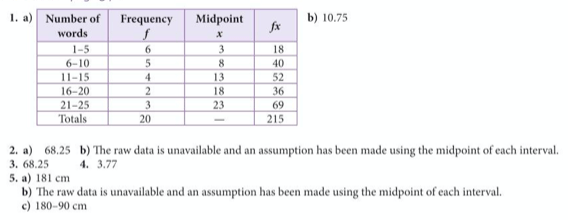
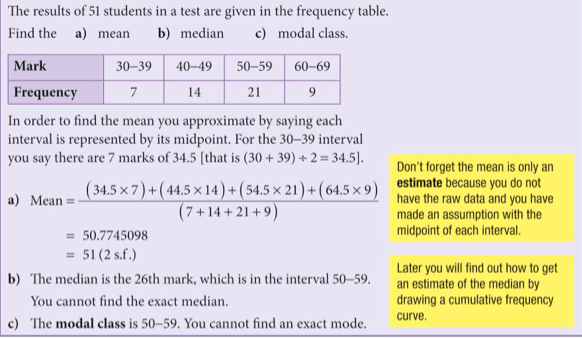
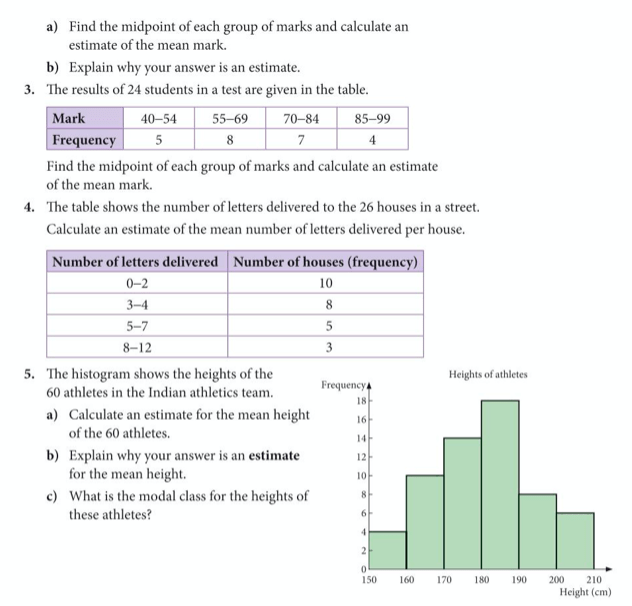
If the data has been grouped, we can still calculate the mean average, and we still use the formula mean = Σfx / Σf , only this time, x means the midpoint of the group, e.g. if the group is 20-25, x will be 22.5. Below is an example to show how we calculate averages from grouped data:
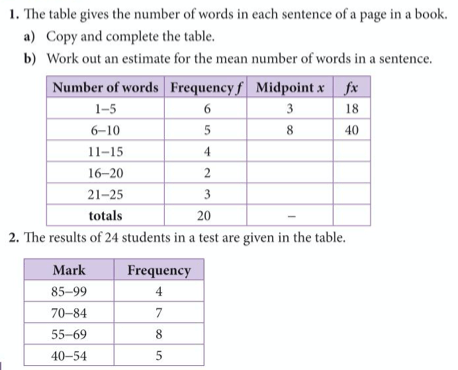
Now complete exercise 6 on pages 348 to 349 of the extended textbook:
The answers are as follows: