The graphs we are going to look at on this page are fundamentally different from all of the other graphs that we have looked at so far, because they are not concerned with frequency.
Conversion Graphs
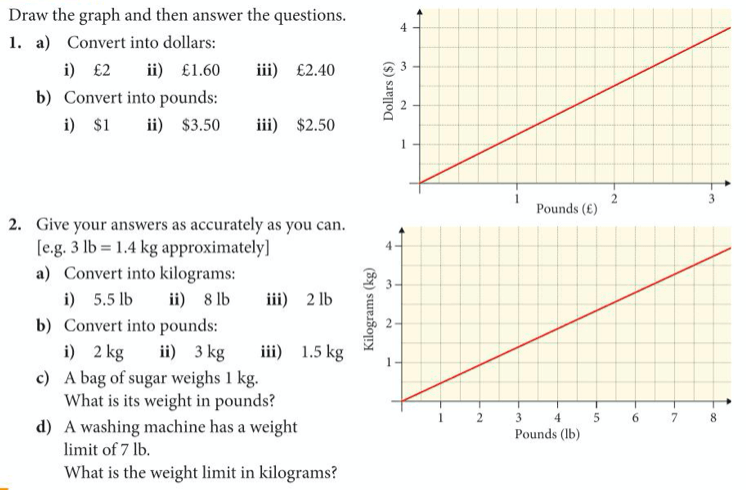
In a conversion graph, one axis details one unit (e.g. dollar price) and the other axis details another unit (e.g. rouble price). We then draw a straight line graph, which allows us to convert between the two units.
To use it to convert money, we draw a straight line (either horizontal or vertical) from the axis with the information we are given to the graph, and then another straight line (either vertical or horizontal) from the graph to the other axis, from which we will read off the answer, i.e. the converted amount.
Exercise: Try the questions in exercise 7 on page 150 of the core textbook, also detailed below:

Answers to the above exercise:

Scatter Graphs and Correlation
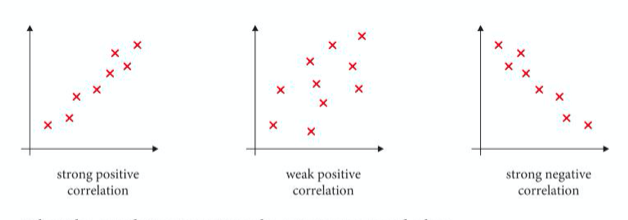
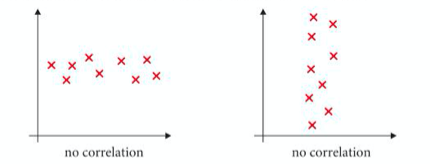
We can use scatter graphs to look for a relationship between two different variables. Suppose for instance we were interested in the melting point and boiling point of various substances. We could mark the melting points on the x-axis and the boiling points on the y-axis. We then draw a cross for each of our substances. The relationships that we can look for on a scatter graph are positive correlation, negative correlation, or no correlation.
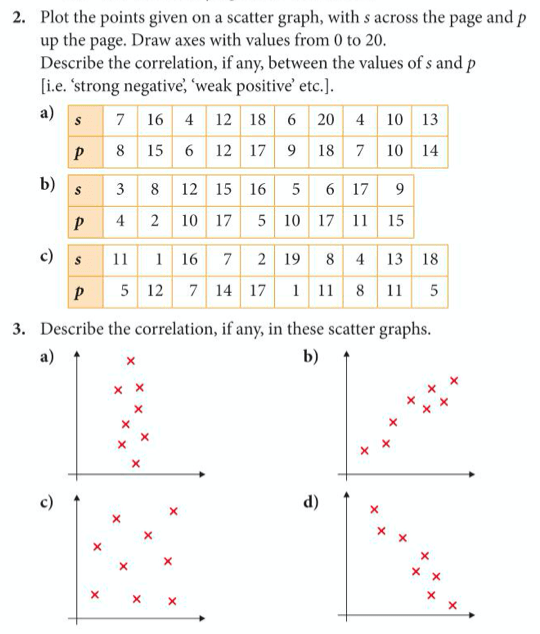
Exercise: Let’s try questions 2 & 3 from exercise 8 on page 154 of the core textbook, also detailed below:
The answers are given below:

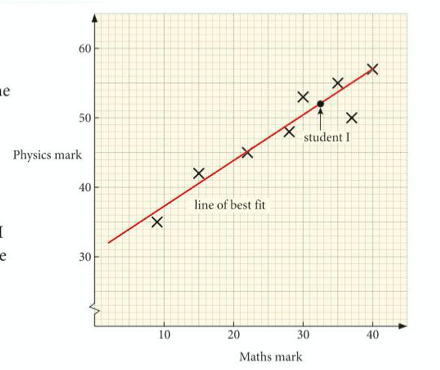
Line of Best Fit
If a graph shows positive or negative correlation, it can be useful to draw a line of best fit, which indicates the general relationship between the two variables and helps us to predict what one of the variables will be if we know the other one. The line should have an equal number of the points on either side of it (it is easier to draw with a transparent ruler).
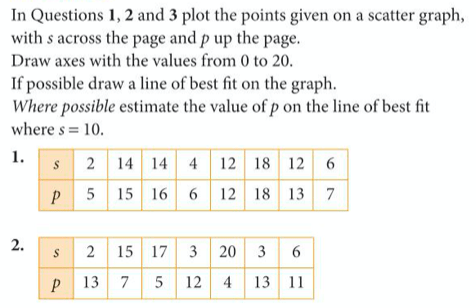
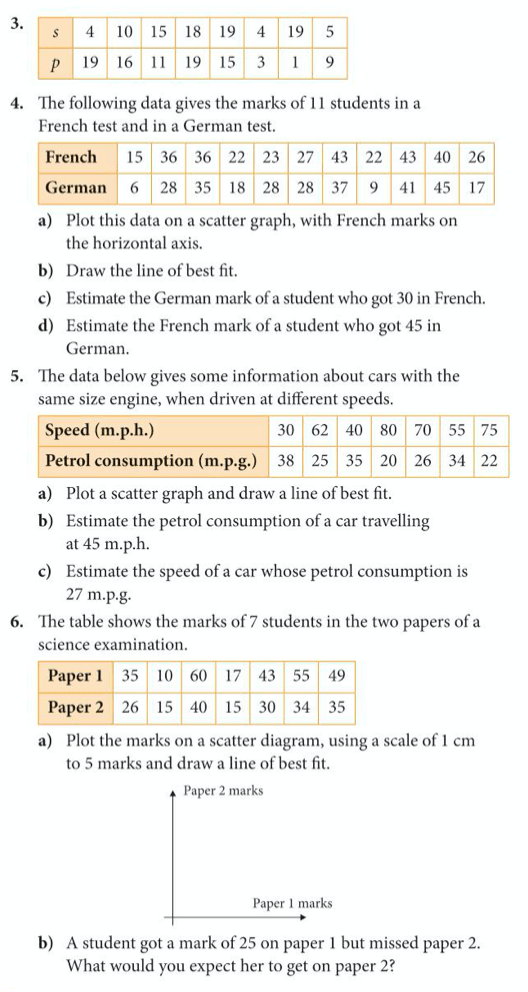
Exercise: Now lets try questions 1 to 6 of exercise 9 on pages 155 and 156 of the exercise book and detailed below:
The answers are below:

Extension Exercise
If you didn’t complete the exercise on histograms on the previous page, now is a good time to go back, reread the example and complete it.
