We will look at two types of probability diagram, both designed to show all of the possible outcomes of an event. All of the possible outcomes of an event are technically called the sample space of an event.
Possibility Diagram
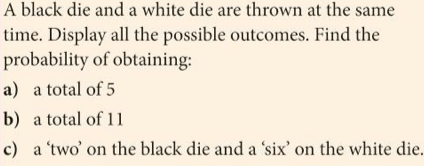
Let’s use an example to illustrate this kind of diagram:
Exercise
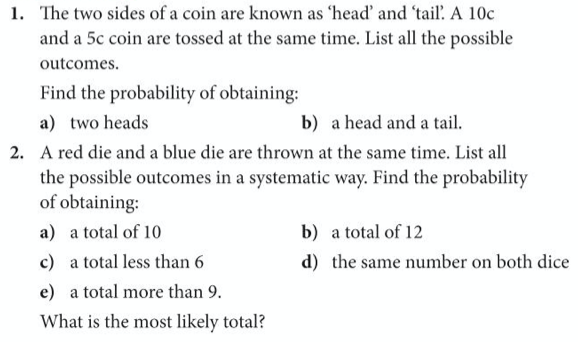
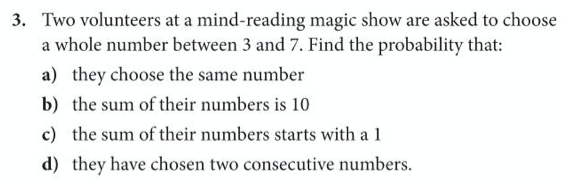
Let’s complete exercise 9 from pages 305 and 306 of the core textbook:
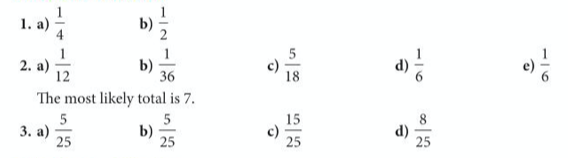
The answers are below:
Tree Diagram
A tree diagram is particularly useful when two events are not independent, that is the second event is affected by the outcome of the first (a common example of this is selecting items without replacement).
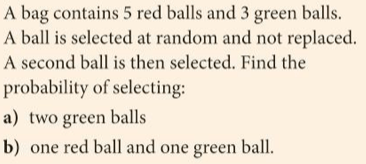
Examples

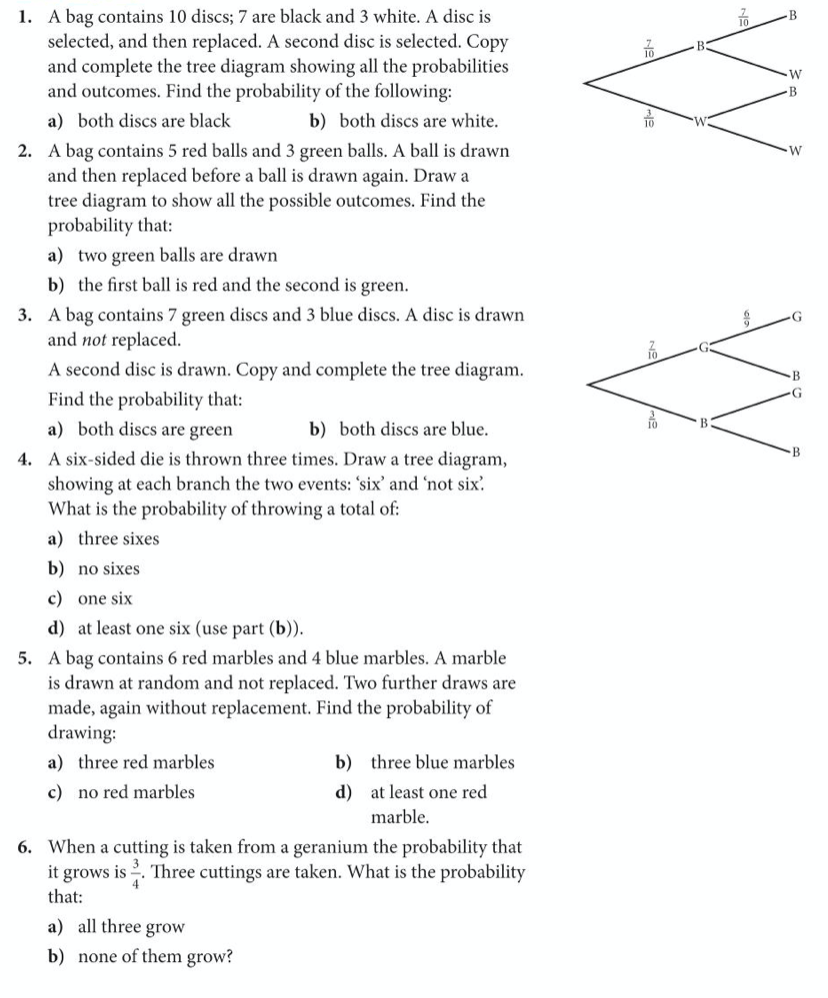
Exercise
Let’s complete exercise 10 from page 307 of the core textbook:
The answers are below:

