Distance-time (or “travel) graphs
Sometimes we use graphs with an x-axis and a y-axis to do calculations in mathematics. Sometimes we use graphs with time along a horizontal axis and distance along a vertical axis to represent a journey. We need to be able to read information from these kind of graphs and if necessary to add more detail to them
Examples
We should be aware that on a distance-time graph, the gradient of the graph tells us the speed (always be careful with units though -> if we want speed in km/h we must check that the distance is in kilometres and the time is in hours).
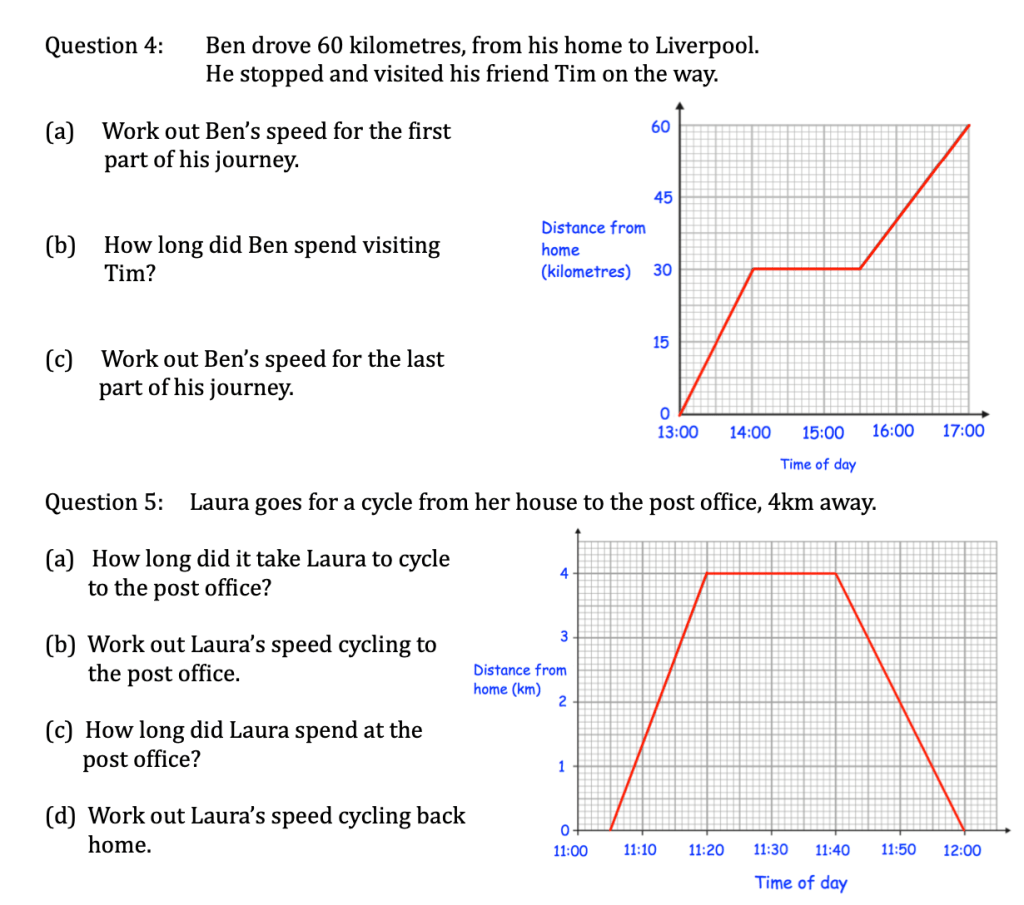

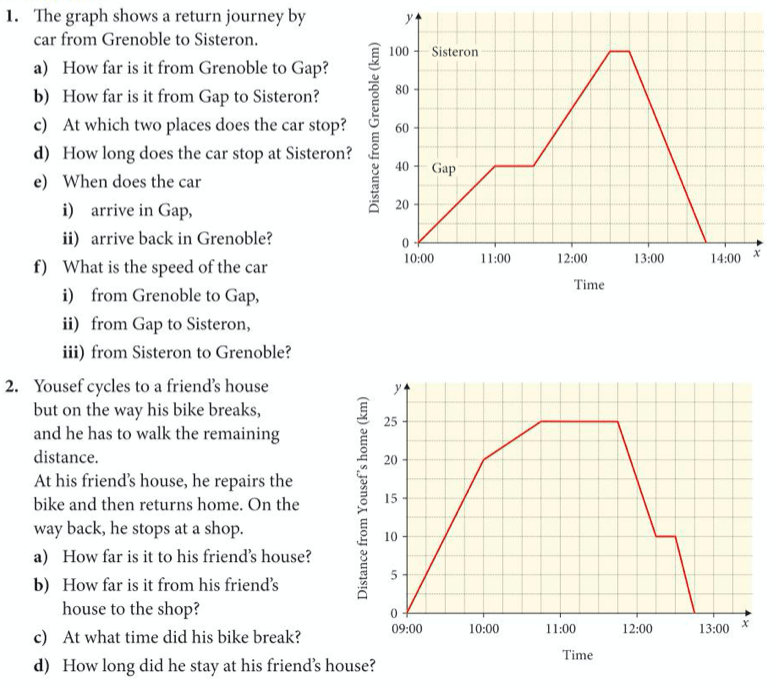
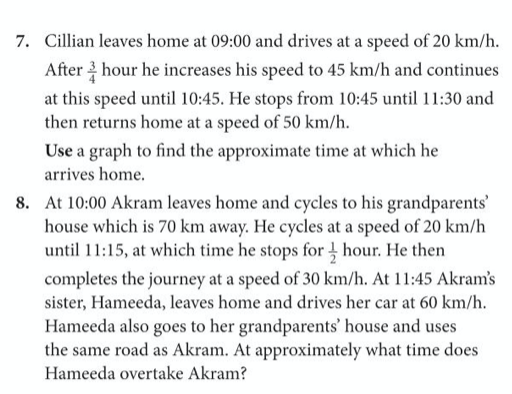
Exercise
Let’s complete exercise 8 on pages 232 to 235 of the core textbook:


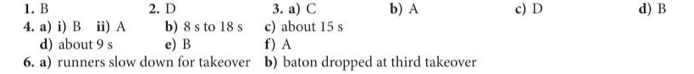
The answers are below:

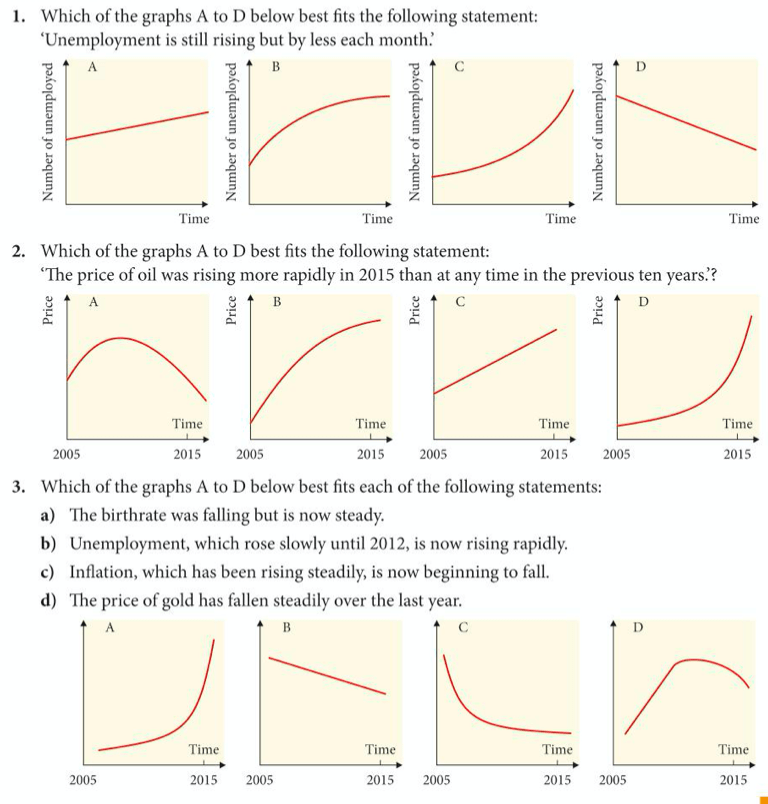
Sketch Graphs
Sometimes in mathematics we need graphs to be extremely accurate. At other times we are only interested in their general shape and some of their key features. In these cases instead of drawing a graph, we talk about sketching a graph:
Let’s try the following exercise o see if we can answer questions from graphs that are drawn as sketches:

The answers are below:
Extension work: Speed-Time graphs
Instead of plotting distance against time with distance on our vertical axis, it is sometimes useful to plot speed against time, with speed on our vertical axis. In this case the gradient of the graphs indicates acceleration and the area under the graph indicates distance travelled.
Example 1
Using the fact that the gradient on a speed-time graph tells us acceleration and the area under a speed time graph tells us displacement, use the graph below to calculate
- The acceleration during the first 10 seconds of the journey;
- The average acceleration during the journey;
- The distance travelled during the 30 seconds.

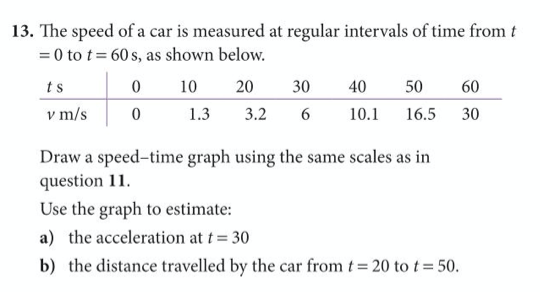
Let’s also practice drawing a speed-time graph
Example 2

Example 3
In the below speed-time graph, find the total displacement during the journey and find the average acceleration during the journey.

Exercise


The answers are below:

