One of the great benefits of cartesian graphs (and the reason they were invented) is that they allow us to graphically demonstrate algebraic equation. For an equation (like 2y=3-x), every value of x can be related to a value of y. If we plot these values as (x,y) coordinates, the resulting graph is the graphical representation of our equation.
Let’s try doing drawing graphs for some simple equations:
Exercise
Let’s complete exercise 10 from page 58 of the core textbook:

All of the above graphs were lines. We can, of course, have graphs that are not straight lines. This will be influenced by the arithmetic operation (e.g. x2, x3) used in the equation.
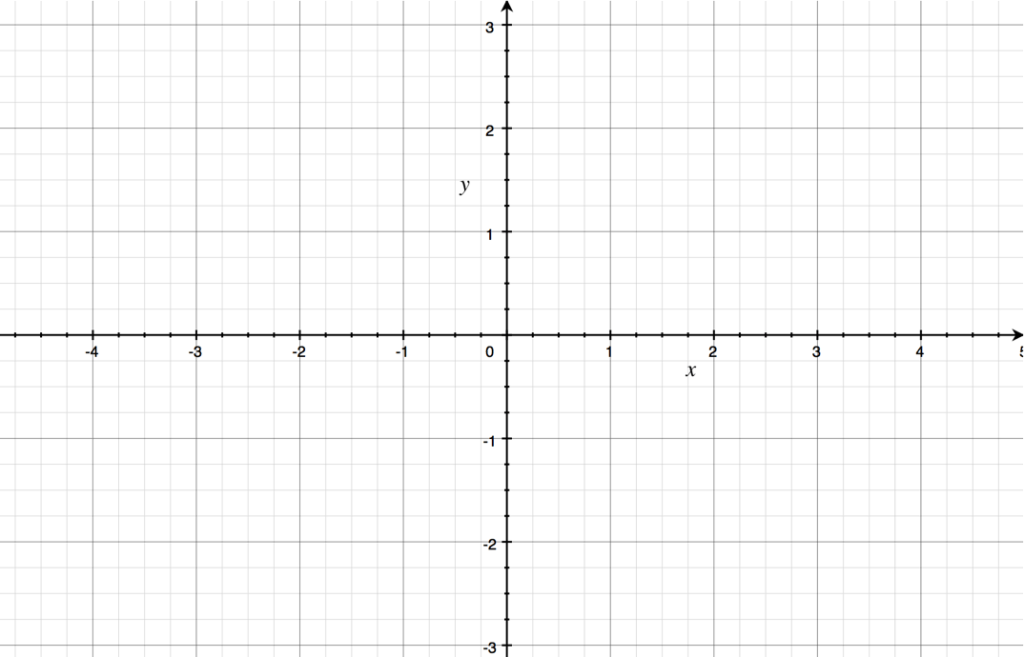
Let’s try plotting y = x2+1 on the graph above.
Exercise
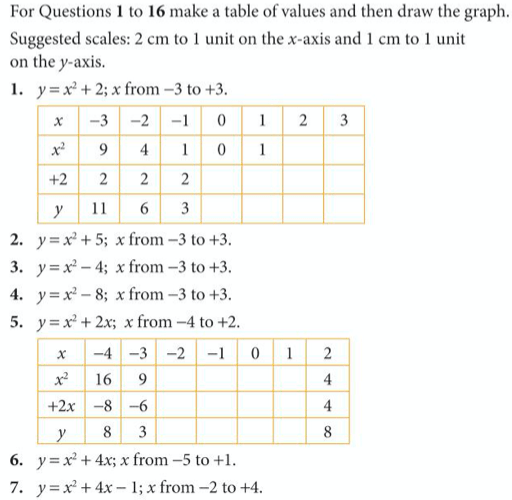
Let’s complete exercise 11 from pages 59 and 60 of the core textbook:

The answers (where relevant) are below:

