First of all, let’s remind ourselves of how to plot points on a set of coordinate axes. Let’s get up and plot some points that the teacher suggests to us:
A function is a relationship, which pairs each input value (x) with an output value (y).
A linear function is a function such that if we drew the pairs of corresponding input and output values as coordinates (x,y), they would make a line on the coordinate grid.
Let’s plot the points for y=2x+3 and y=36/x and think about which one of these is a linear function.
In the following exercise you will need to draw some graphs.
Each time you draw a graph you need a horizontal x-axis and a vertical y-axis, both drawn with a ruler. You must mark a scale on each axis which goes up in equal steps. The size of the steps will depend on the specifics of the question (always read the question carefully first).
Exercise
Let’s complete exercise 14A from pages 220 and 221 of the textbook:


The answers are below:


Note that in the above exercise, we rearranged equations to make y the subject of the equation before drawing the line. There is actually an easier way to draw a line from an equation, using the cover up method.
Let’s try it to draw the equation of 2x+5y = 30. Note that if we know two points on a line, we are able to confidently draw the line.
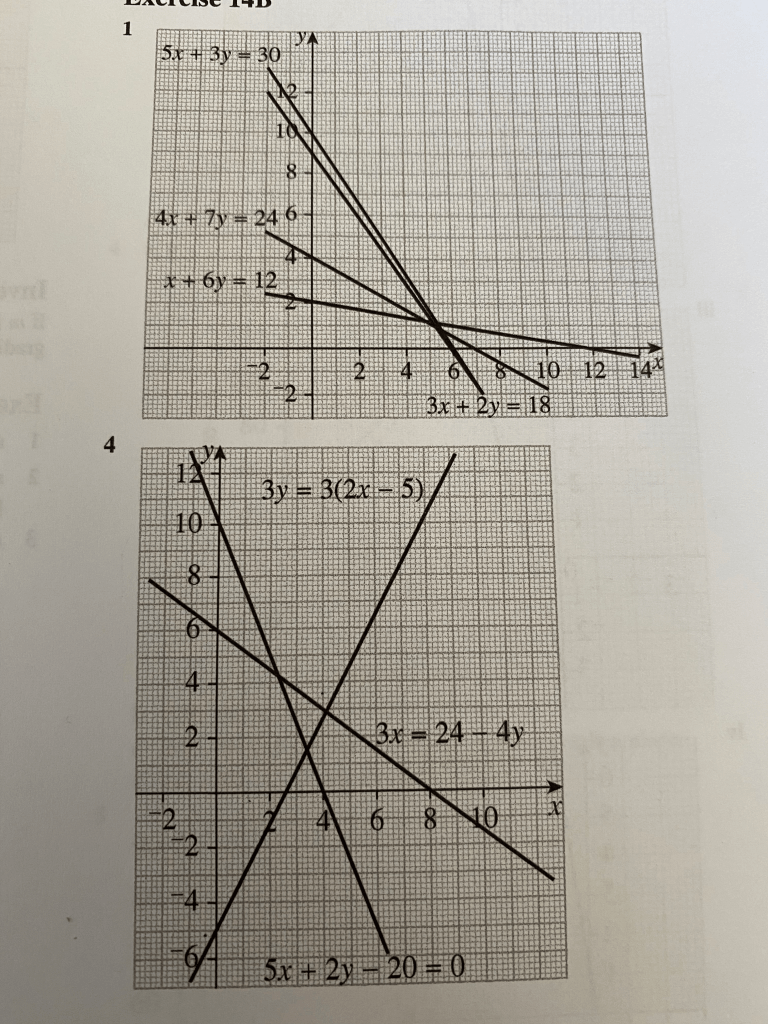
Exercise
Draw the graphs for the following:

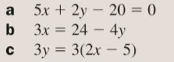
The answers are below: