A stem-and-leaf diagram is an excellent way of representing a small dataset so that we can see the overall “shape” of the data without losing the original values. It is also very useful for comparing two datasets.
Let’s look at how to make a stem-and-leaf diagram for the following data. We first make an unordered stem-and-leaf diagram and then do an ordered stem-and-leaf diagram. It is very important that we include a key.

Stem and leaf diagrams can be used regardless of the size of the numbers in the dataset. It doesn’t matter if the numbers have a size like 201,392 or 0.0428. We just adapt the stems accordingly.
Exercise
Let’s strengthen our knowledge about stem-and-leaf diagrams and practice drawing them in the the exercise 12E from pages 181 to 182 of the textbook:
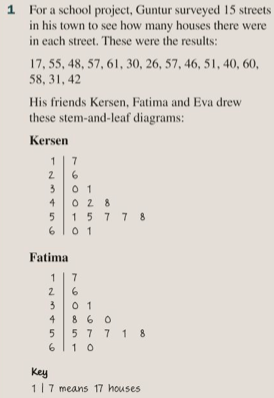
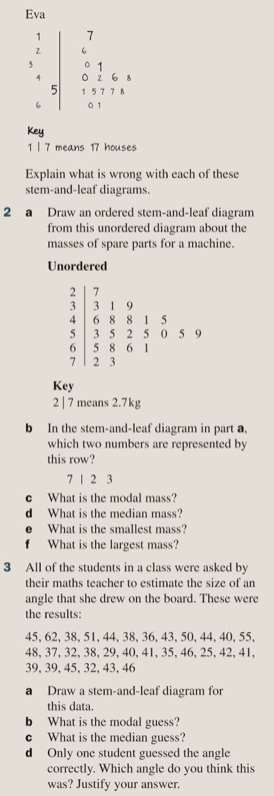
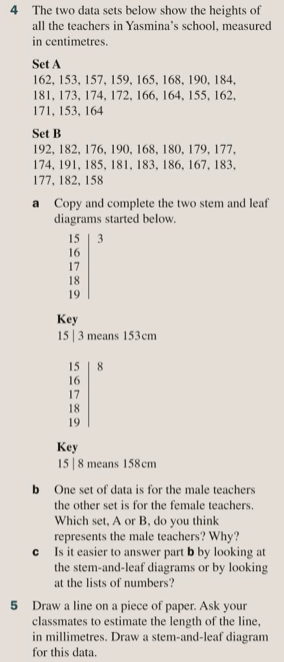
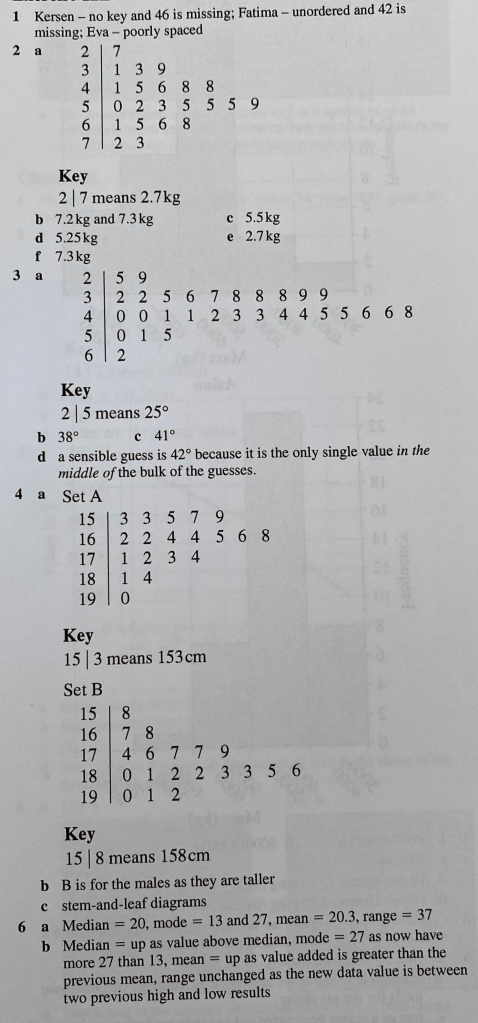
The answers are below: