A line chart is another type of frequency diagram, more like a bar chart than a pie chart, but instead of drawing a full bar, a single point is marked at the top of the bar to represent the bar and these points are joined up.
Example
Exercise
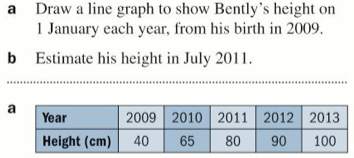
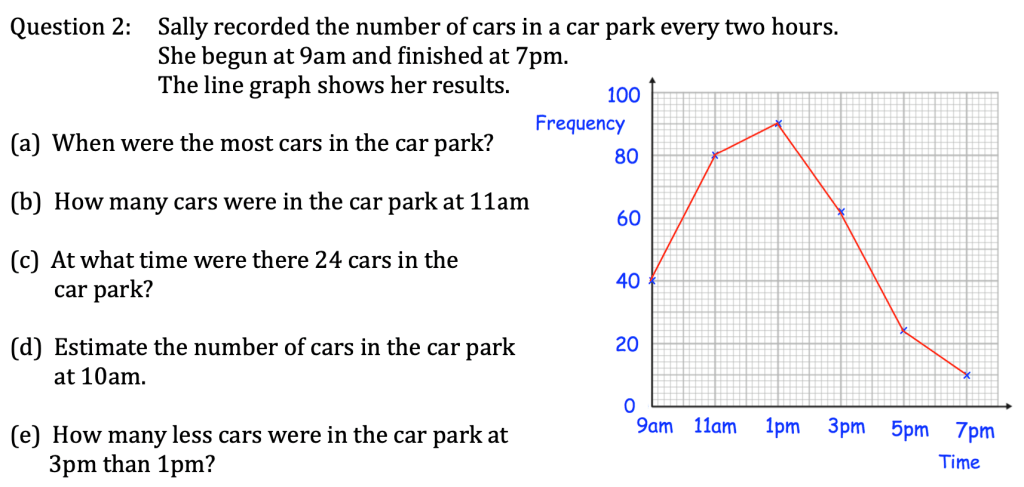
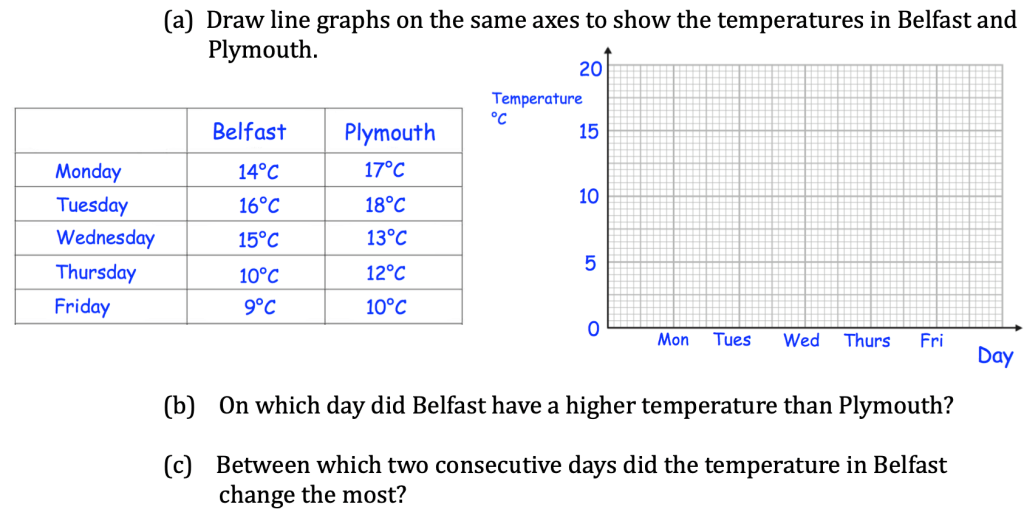
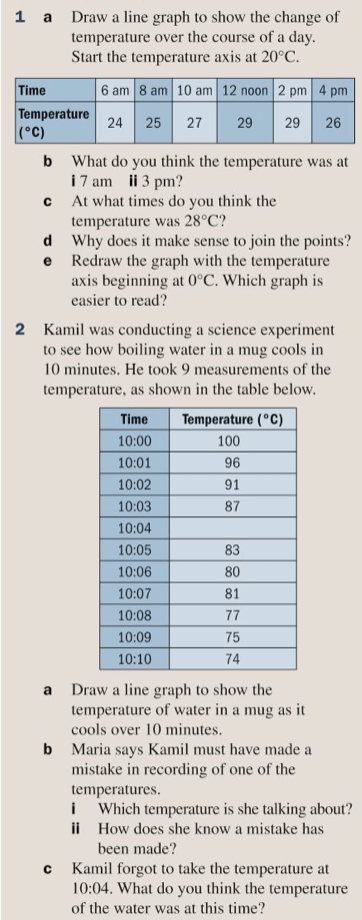
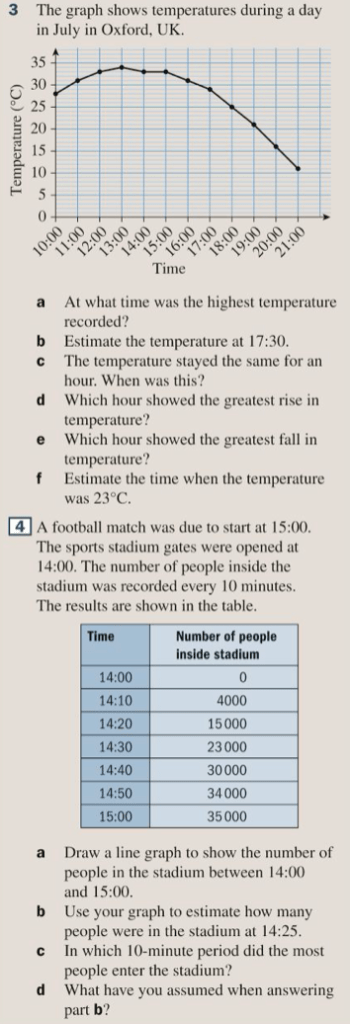
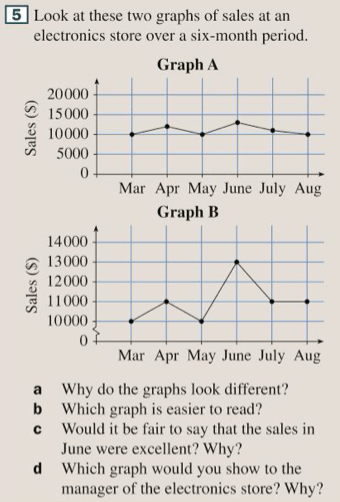
Let’s complete exercise 12C on pages 176 and 177 of the textbook:
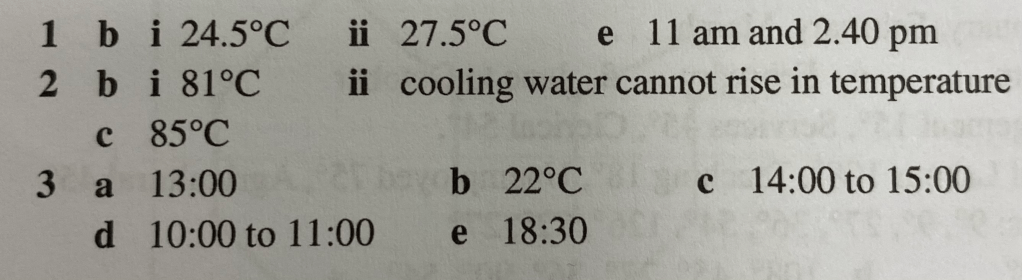
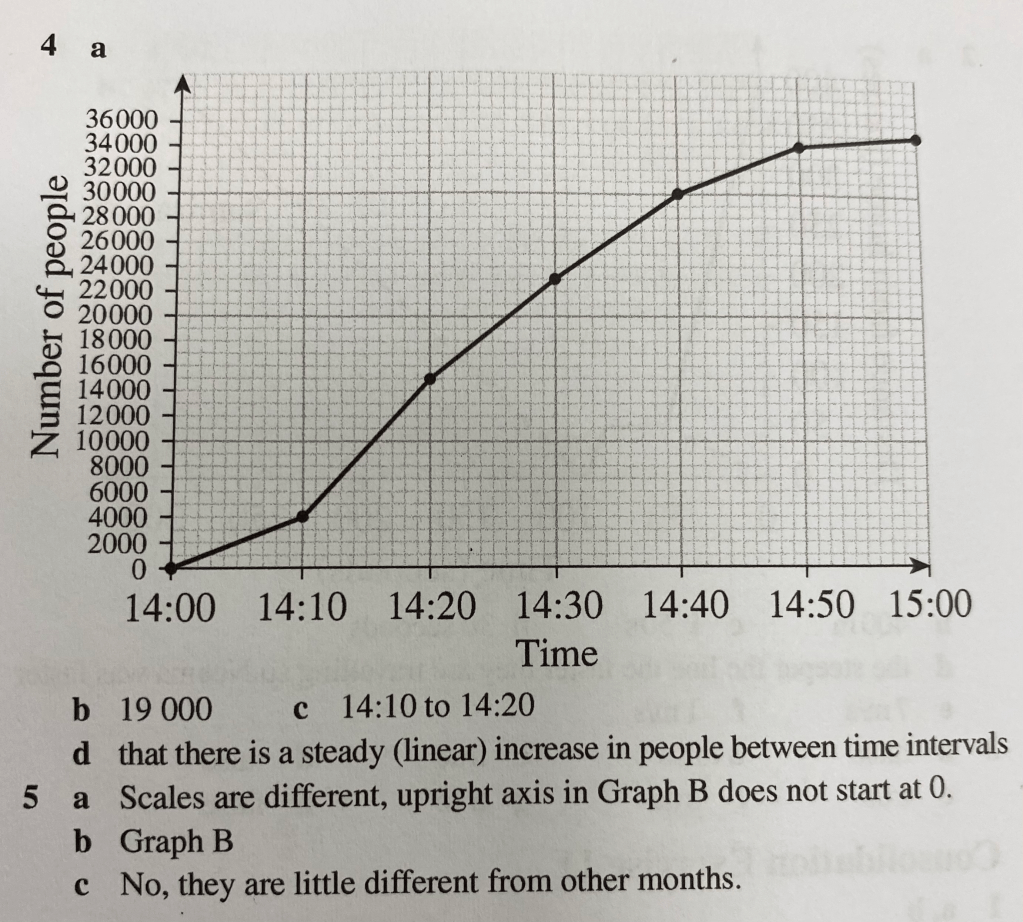
The answers are below: