We will consider two types of table that are useful to us as statisticians. These are 2-way tables and frequency tables.
2-way tables
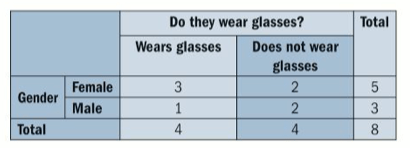
In a 2-way table, one variable is listed across the top (e.g. eye colour) and a different variable is listed along the side (e.g. hair colour) and the number of people with each different combinations is measured in the body of the table (sometimes called the sample space).
Here is an example of a 2-way table which looks at how many people of each gender wear glasses:
Exercise
Let’s complete exercise 6E from page 86 to practice reading information from frequency tables:
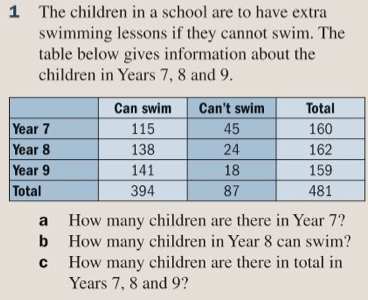
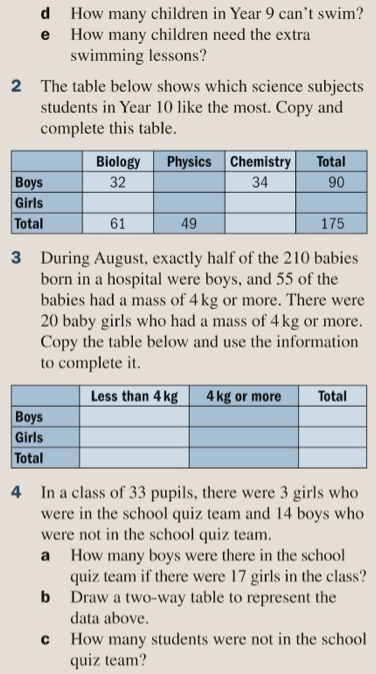
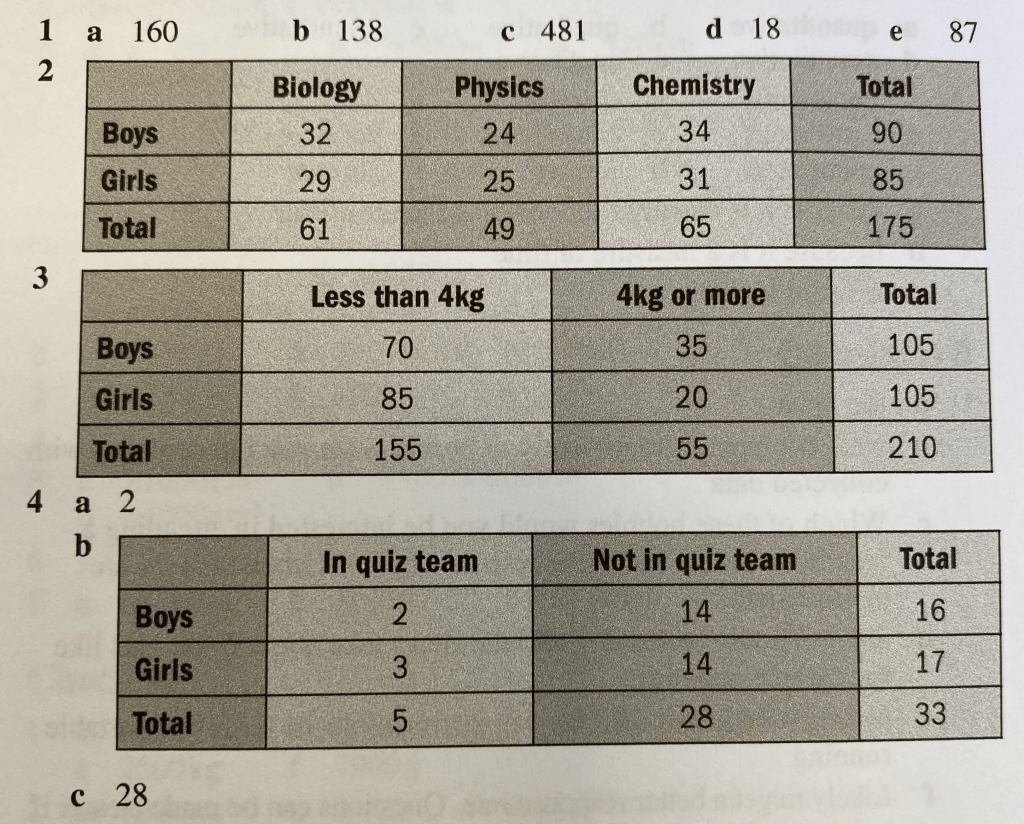
The answers are below:
Frequency tables
The most common type of table we will encounter in Statistics is the Frequency Table.
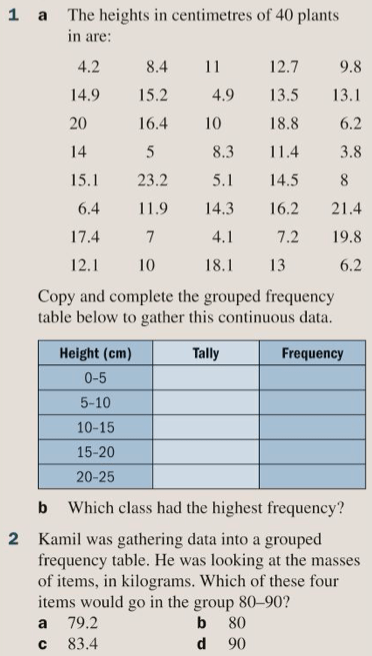
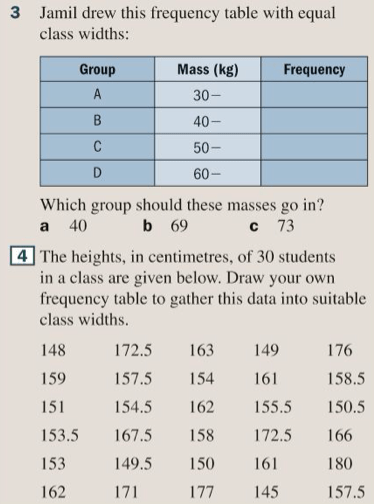
This is a very efficient way of summarising the information in a dataset. It will always be useful when making a frequency table to make a tally-chart first. Let’s see the process for the following dataset (what kind of data is it?):
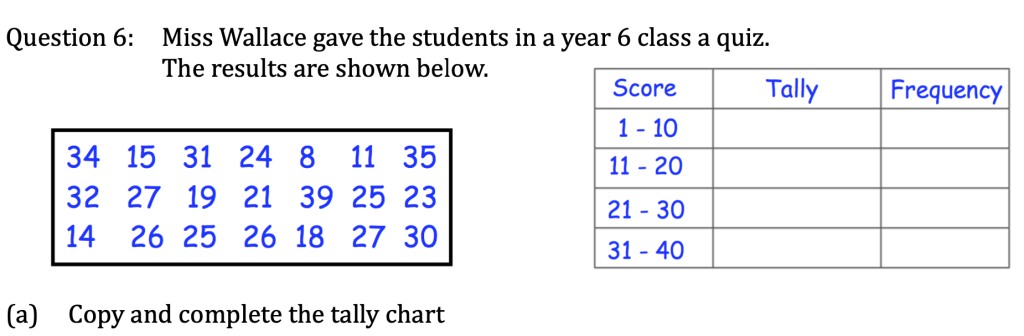
We always check that we have completed the frequency chart correctly by checking that the sum of the frequencies equals the number of pieces of data in the dataset.
Exercise
Let’s complete exercise 6F from page 87 of the textbook:
The answers are below:

