A function is a rule, or a set of rules, that are applied to inputs to give outputs. For instance 2n-3 is a function. It turns the input “5” into the output “7”. What does it turn the input “15” into?
Exercise
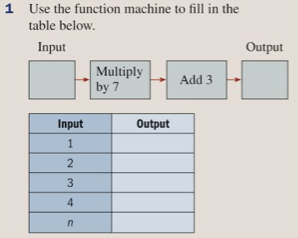
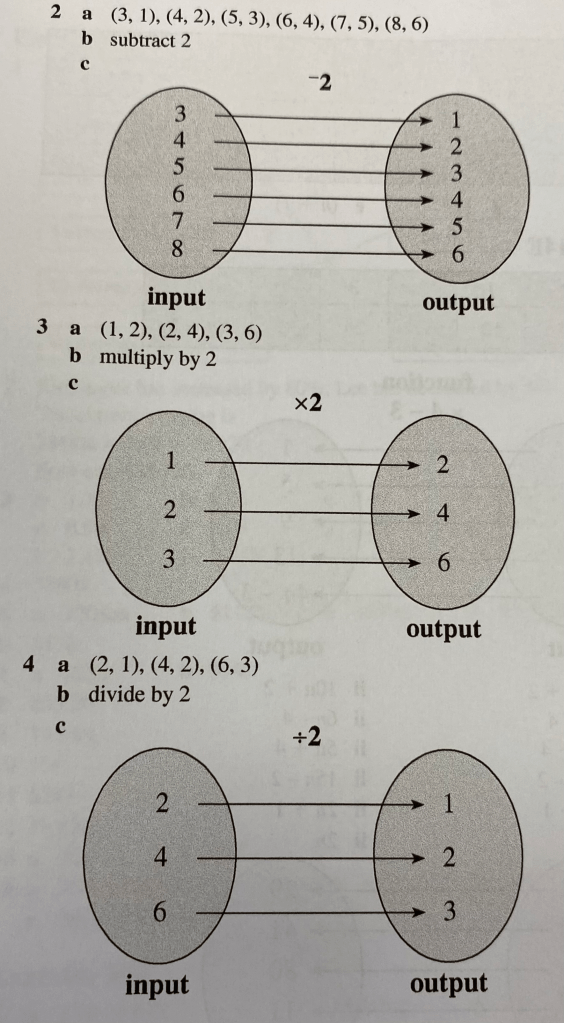
Let’s have ago at completing the mapping diagrams in the exercise below (exercise 14E from pages 221 and 222 of the textbook). You may notice that the logic we apply is quite similar to the logic we applied when we were working with sequence.
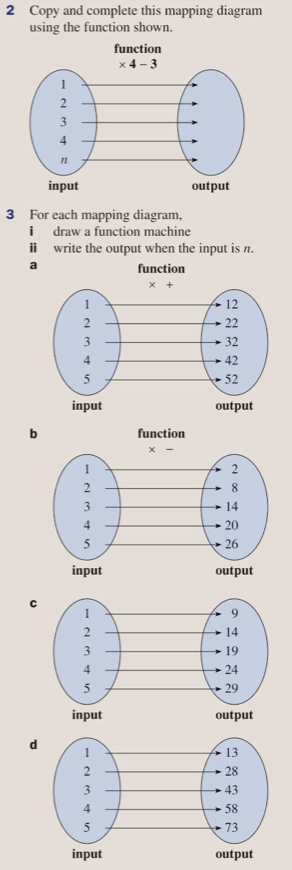


The answers are below:
Linear Graphs
The ideas that we have looked at about linear (or arithmetic) sequences and functions have a direct analogy with linear graphs. The fact that a graph is a line shows us that the output increases by a fixed amount (i.e. on the y-axis) for every equal increase in the input (i.e. on the x-axis.
Exercise
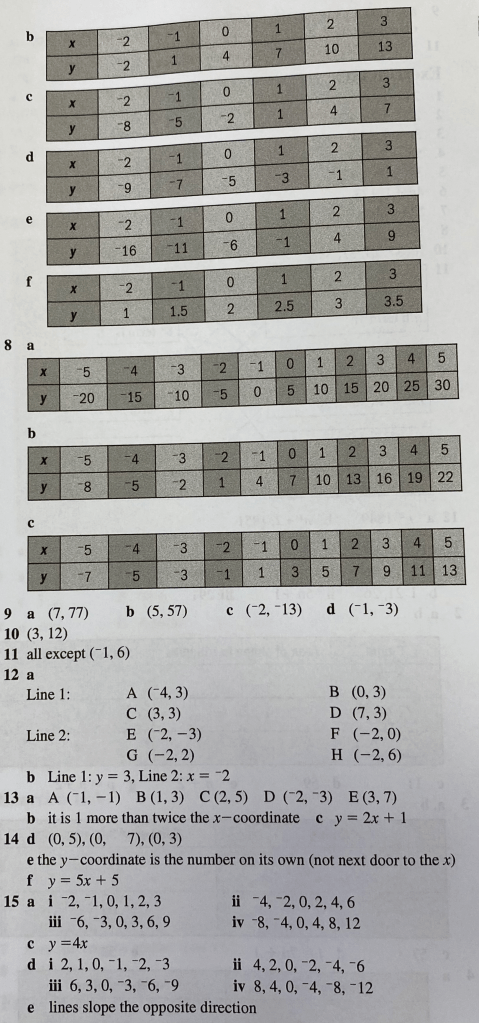
Let’s help ourselves to understand this with this short exercise (14F from page 223 of your textbook) where we identify the coordinates of points, and then use that to identify the function that is being applied. Remember, the x-coordinates are like the inputs and the y-coordinates are like the outputs.

The answers are below:

Exercise
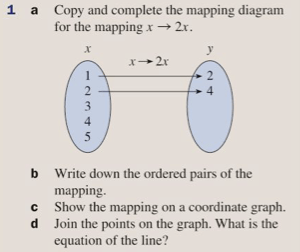
Now let’s try going the other way. We will be given a rule, or a function, and we have to identify some coordinates based on this function and then draw on a graph the relevant line. The exercise is 14G from pages 223 and 224 of your textbook.


The answers are below:

Summary
Hopefully now we should see that although information can be presented in quite different ways in mathematics, and questions can be structured in ways that appear different, often the logic we apply is the same. Let’s keep that in mind below.
Example

Exercise
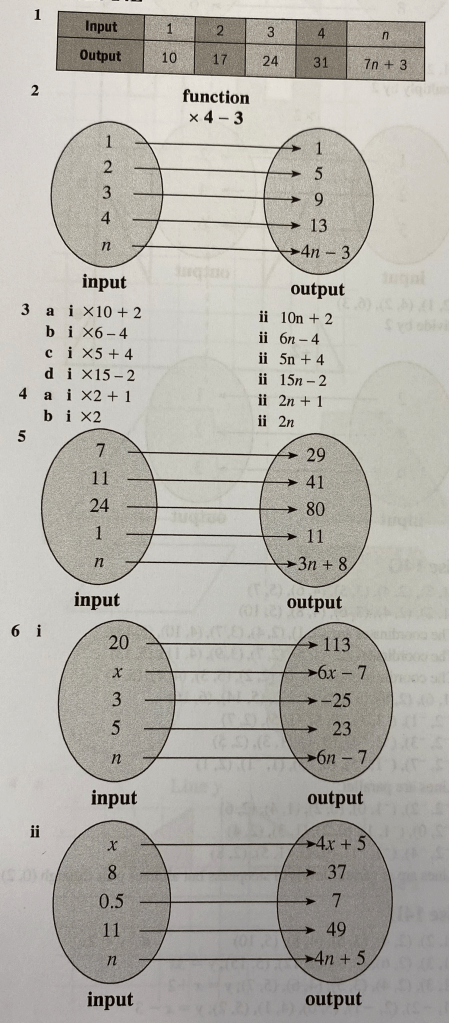
Let’s complete exercise 14H from pages 225 to 227 of your textbook:


The answers are below: