Ted wants to use measurements of rainfall in certain specific parts of a city to estimate rainfall in other parts of the city.
Using the values of known points on a 2D grid to estimate the values at other points is called interpolation.
A simple method of interpolation is called nearest neighbour interpolation. To estimate the value of a variable at any point, we use the variable’s value at the nearest known data point. A Voronoi diagram can help us quickly identify the nearest known data point.
If the given point lies on an edge or at a vertex, we take the average of the closest known data points.
Worked Example
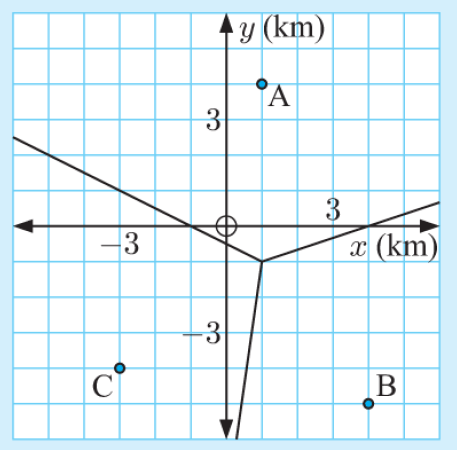
Ted measured the rainfall in his city at three locations A, B and C marked on the map below:
His results were as follows:
| Location | Rainfall (mm) |
| A | 12 |
| B | 7 |
| C | 15 |
- Use nearest neighbour interpolation to estimate the rainfall at:
- (-4,1)
- (3,-2)
- (1,-2)
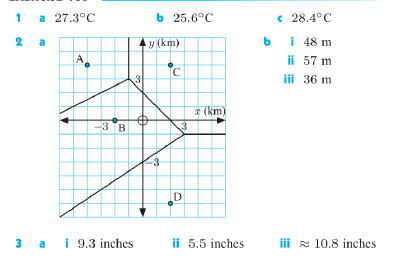
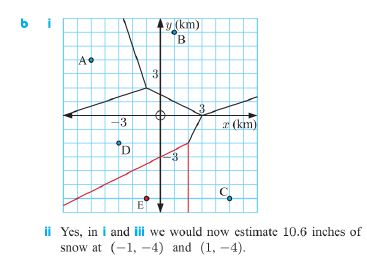
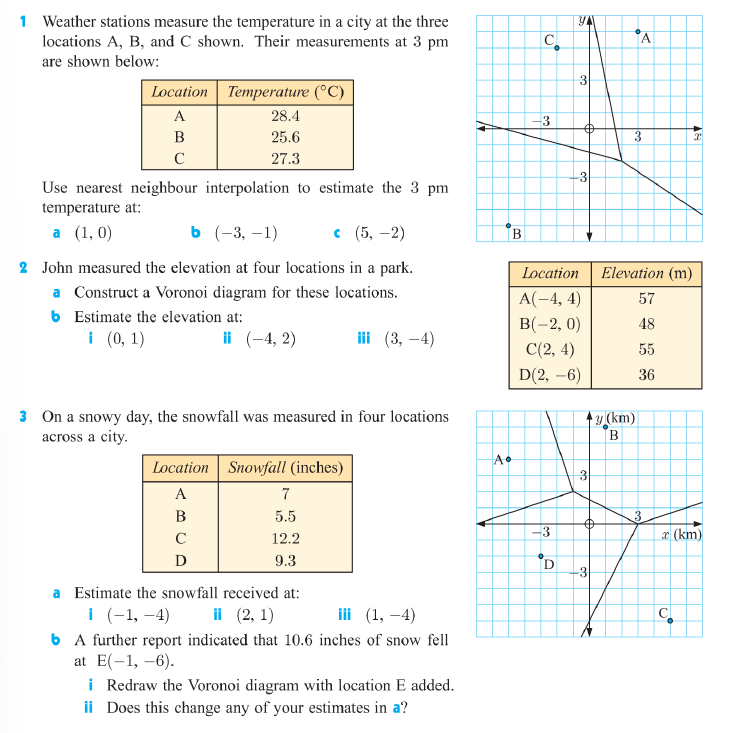
Exercise
Answers