Opening Problem.
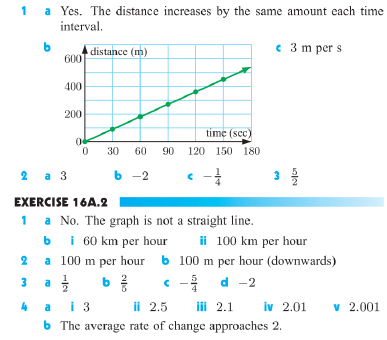
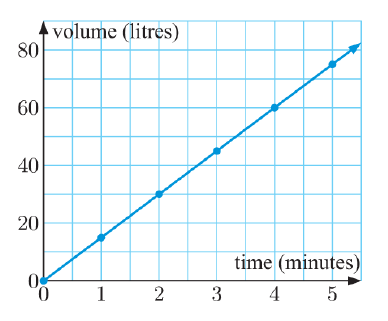
- Consider the graph of ‘volume of water added to a container’ against ‘time’.
- Can you explain why this graph is a straight line passing through the origin?
- What does the gradient of the straight line tell us?
- Now consider the graph of ‘depth of water in a container’ against ‘time’.
- Can you explain why this graph is a straight line for a cylindrical container?
- Can you explain why this graph is not a straight line for a conical container?
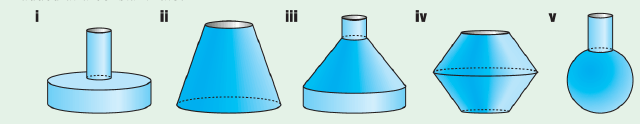
- By examining the shape of each of the containers below, can you predict the depth-time graph when water is added at a constant rate?
Consider the depth-time graph below:
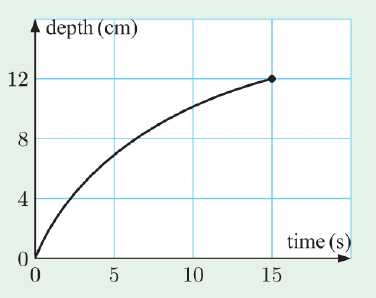
- How can we measure the average rate at which the depth increases from t = 5 to t = 10 seconds?
- How can we measure the instantaneous rate at which the depth is increasing at the instant when t = 8 seconds?
Constant & Average Rates of Change
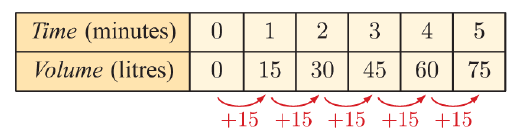
Consider a hose filling a swimming pool. The above table shows the volume of water in the pool recorded at 1 minute intervals. The rate of change in volume is constant, so the graph of volume against time is a straight line, as shown below, with rate of change 
In typical real-world situations, rates of change are not constant, but vary over time. Consider this graph, which shows the temperature of a glass of water left in the sun:
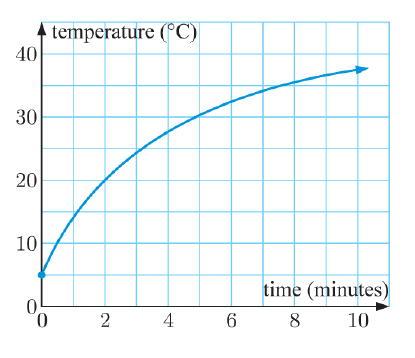
We can see that the temperature increases quickly at first and then more slowly as time goes by. In these cases we can find an average rate of change over a particular time interval. For instance, from time t = 0 to t = 2 minutes, the temperature increases from 5 to 20 degrees Celsius, so the average rate of change is 
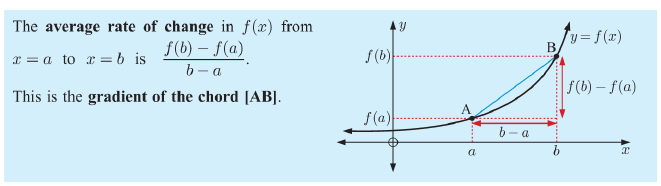
In the context of functions, we say that the average rate of change in f(x) from x = a to x = b is 
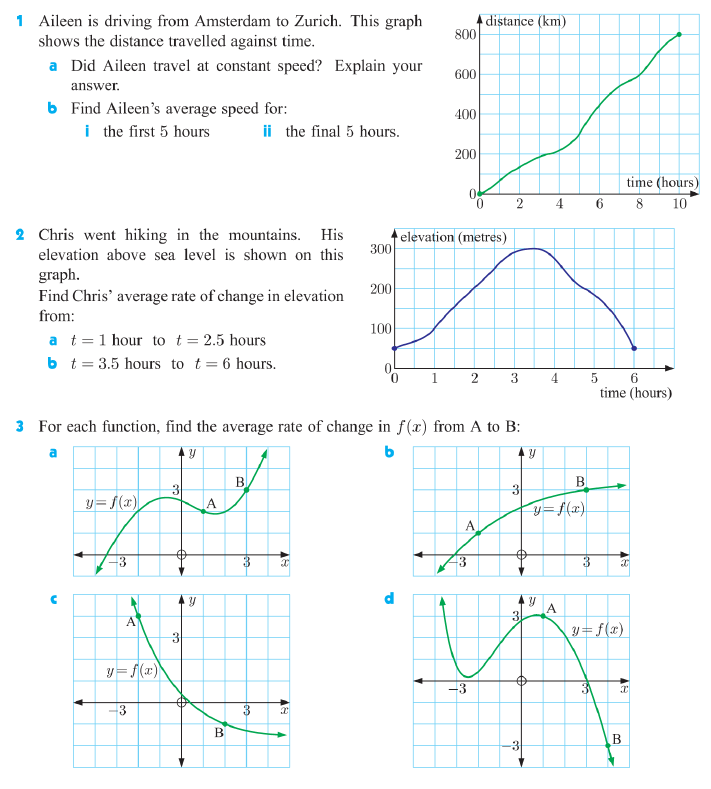
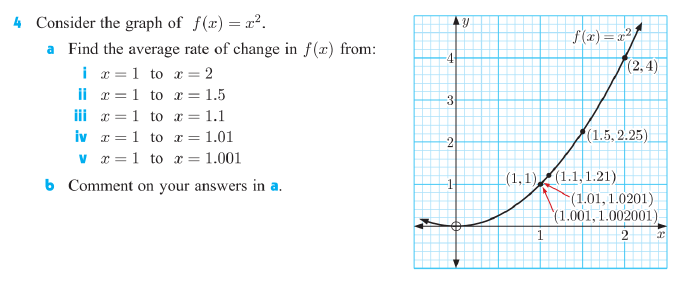
Exercise 1
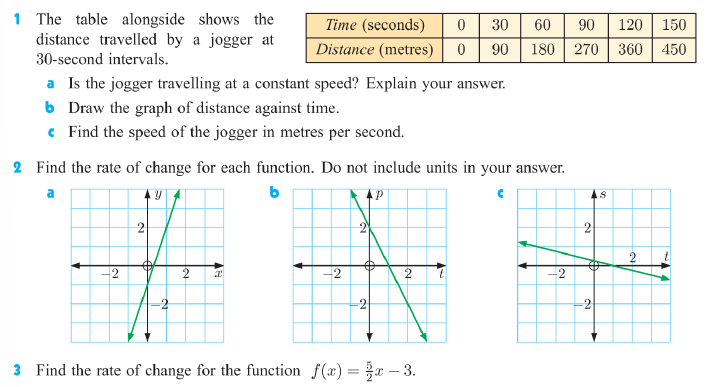
Exercise 2
Answers