When you look at a speedometer in a car, you don’t want to know average speed, but instantaneous speed, i.e. the speed at which you are travelling at that moment.
Investigation
A ball bearing is dropped from the top of a tall building. The distance it has fallen, D, is measured after t seconds, giving the following graph:
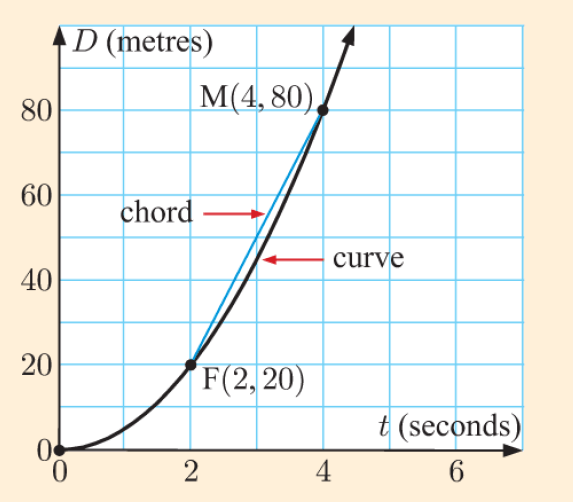
Consider a fixed point, F, on the curve when t = 2 seconds. We can choose another point M and draw the line segment (or chord) between the two points.
If we start by letting M be the point when t = 4 seconds, the average speed of the ball bearing over the time interval 

Now consider what happens as M gets progressively closer to F.
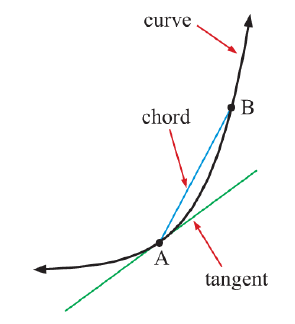
From the investigation and referring to the diagram above, we notice that as the chord from a fixed point gets shorter, the average rate of change between the two endpoints of the chord approaches the instantaneous rate of change. Graphically, the chord (and its corresponding gradient) gets closer to being the tangent (and its gradient).
The instantaneous rate of change in f(x) at any point A on the curve is the gradient of the tangent at A.
Worked Example
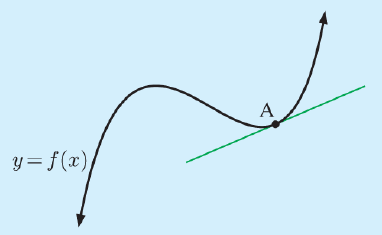
Use the tangents drawn on the diagram below to find the instantaneous rate of change on y = f(x) at (a) A, and (b) B.
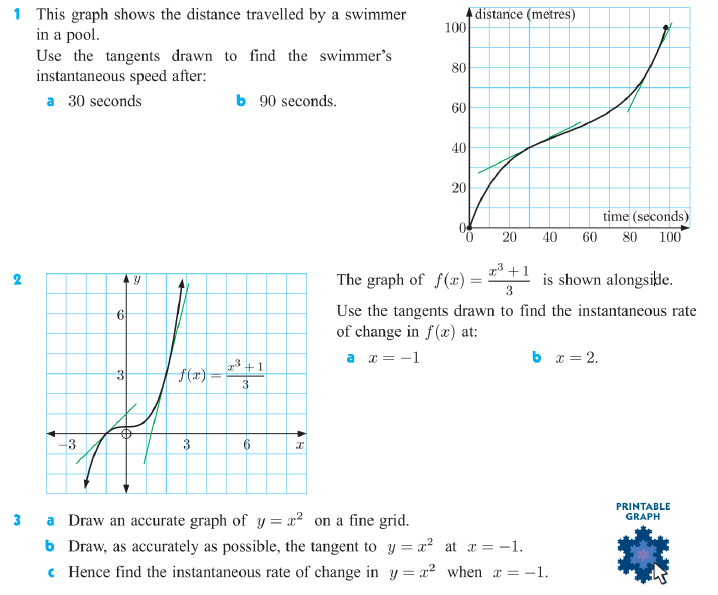
Exercise
Answers
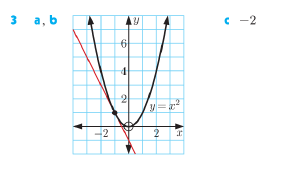
(1.) (a) 0.5ms-1, (b) 2ms-1, (2.) (a) 1 (b) 4