Averages or measures of location
There are three averages that we need to be able to calculate, they are the mean, the median and the mode
We need to be able to calculate them for raw data, for tabulated data and for grouped data
Raw data:
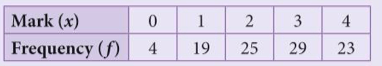
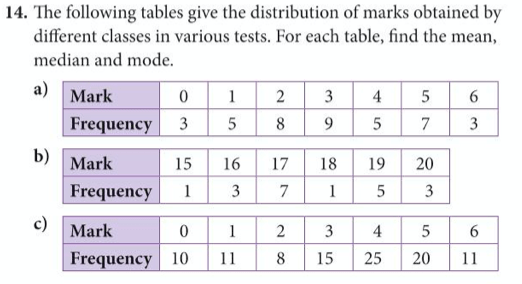
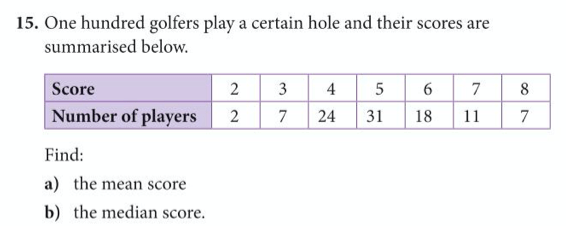
Tabulated data:
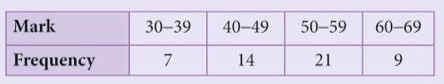
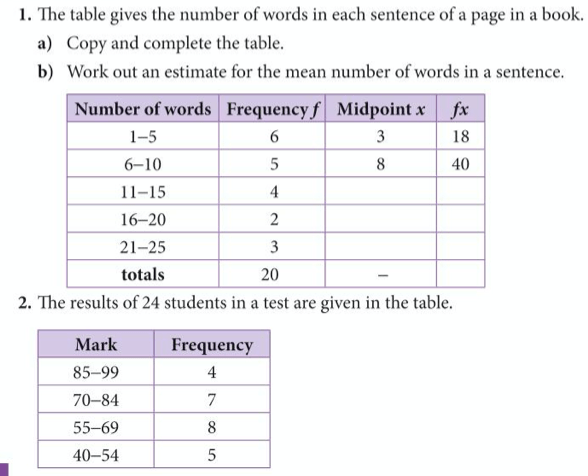
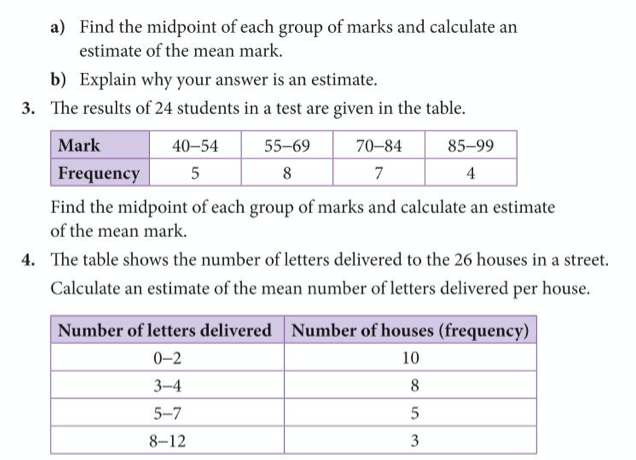
Grouped data:
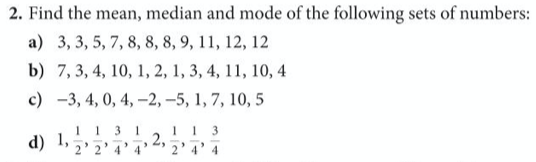
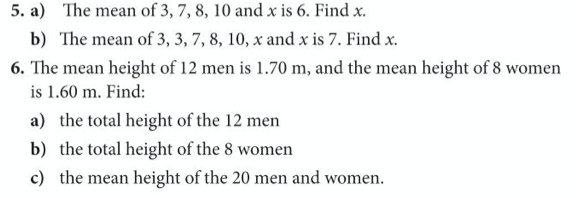
Practice these by doing the following questions (from your extended textbook pages 345-349 Exercise 5: questions 2, 5, 6, 14, 15 and Exercise 6: Questions 1-4)
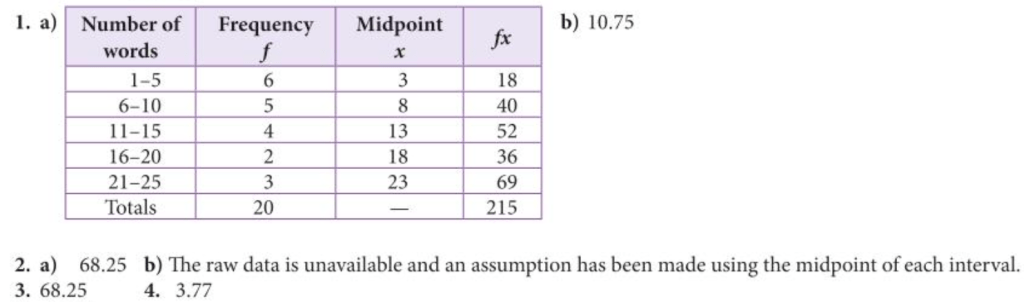
Answers to the above questions:


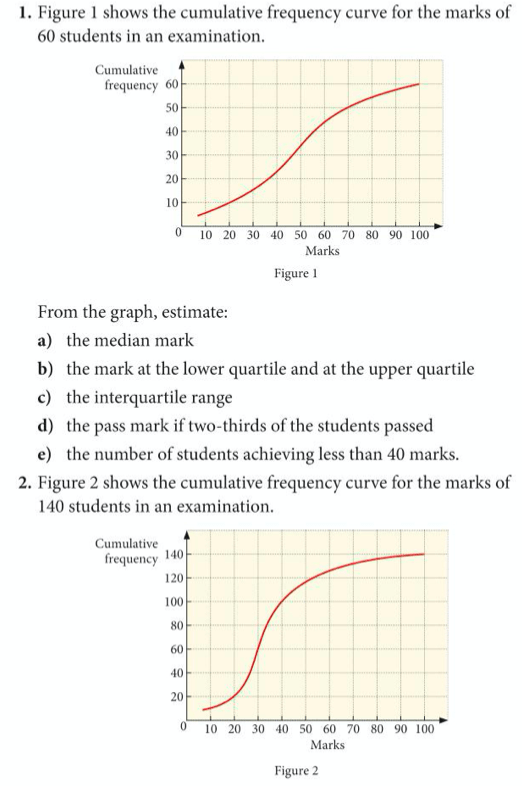
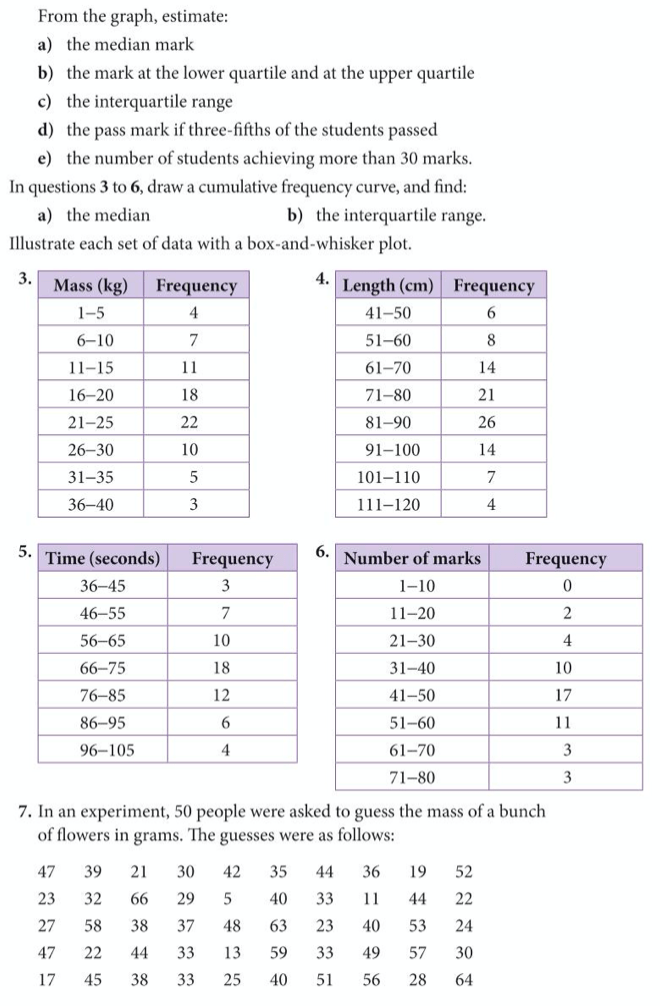
Cumulative Frequency: Tables and Graphs
Cumulative frequency, which is a running total is very useful to us when finding the median and related measures such as the interquartile range (a good measure of spread). The results can be usefully illustrated on a box-and-whisker plot.
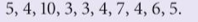
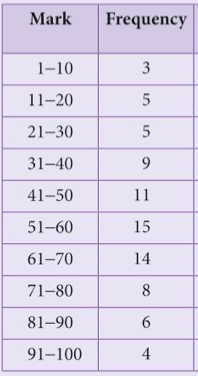
- From the following data:
- construct a cumulative frequency table;
- construct a cumulative frequency curve;
- estimate the median;
- estimate the interquartile range; and
- draw a box-and-whisker plot.
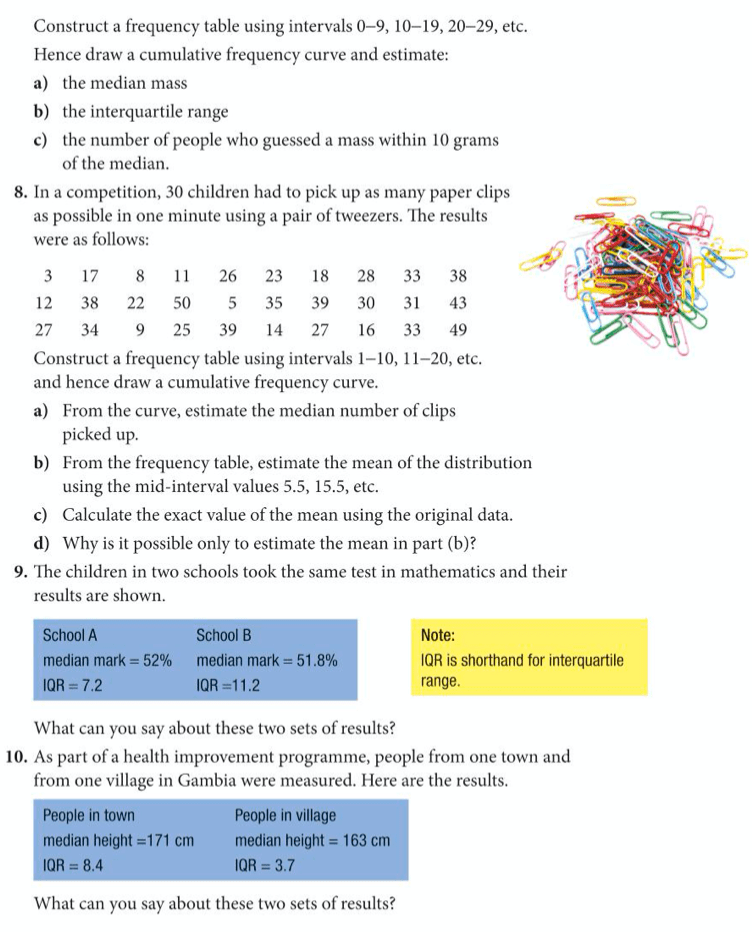
Complete exercise 9 on pages 357-359 of the extended texbook (detailed below):