In economics we will often use models. Whilst these are necessary, we should always keep in mind their limitations.
The first model we will look at is the production possibility curve (“PPC“), a curve showing the maximum combinations of goods or services that can be produced in a set period of time given available resources.
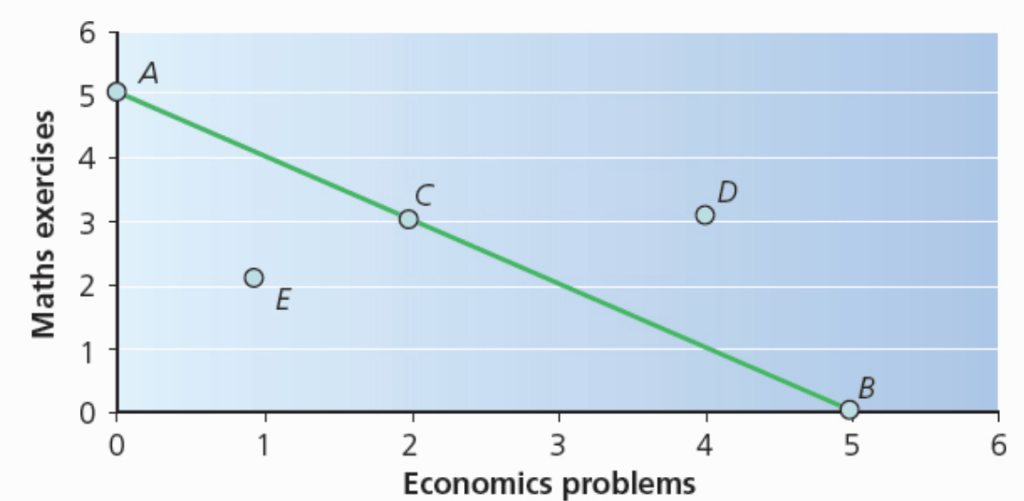
Let’s consider the production represented by each of the letters above.
We can also identify the opportunity cost of completing one more maths exercise in the graph above, remembering that opportunity cost is the value of the next best alternative.
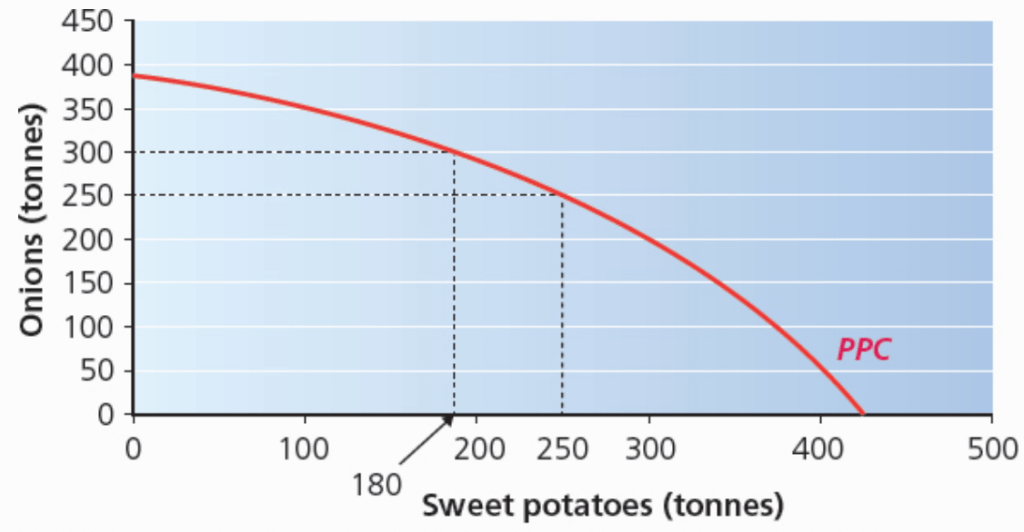
In reality, opportunity cost will rarely be constant – why might this be? Because of this the below PPC is more realistic.
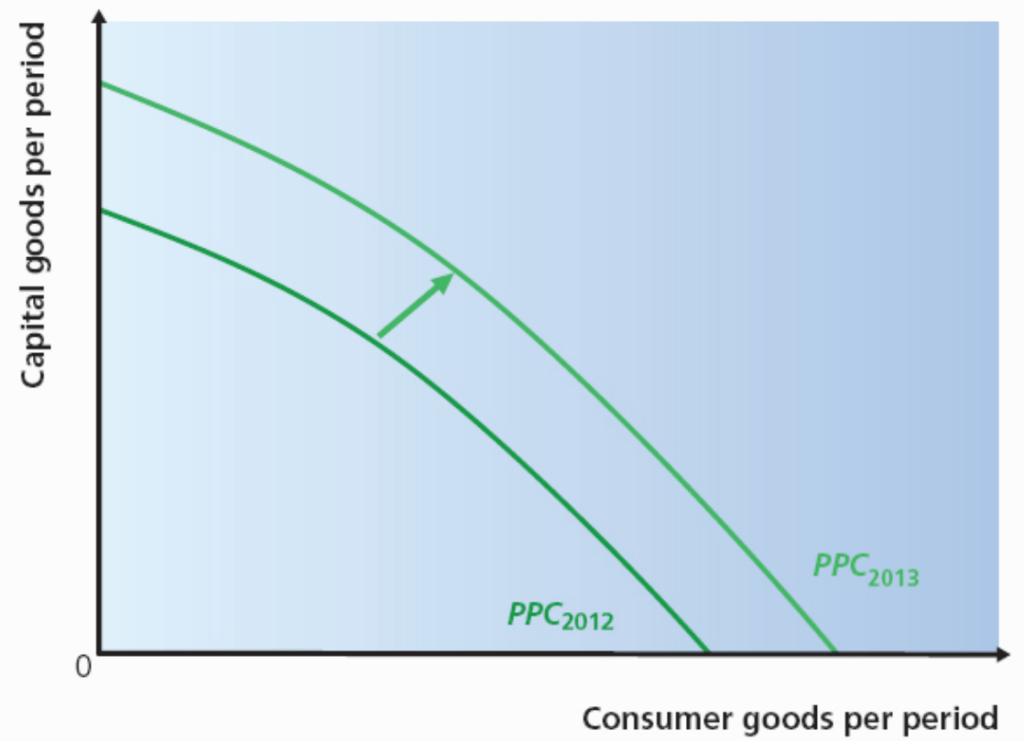
We can also think about this on an economy level, by comparing consumer goods produced in a year with capital goods produced during that same year.
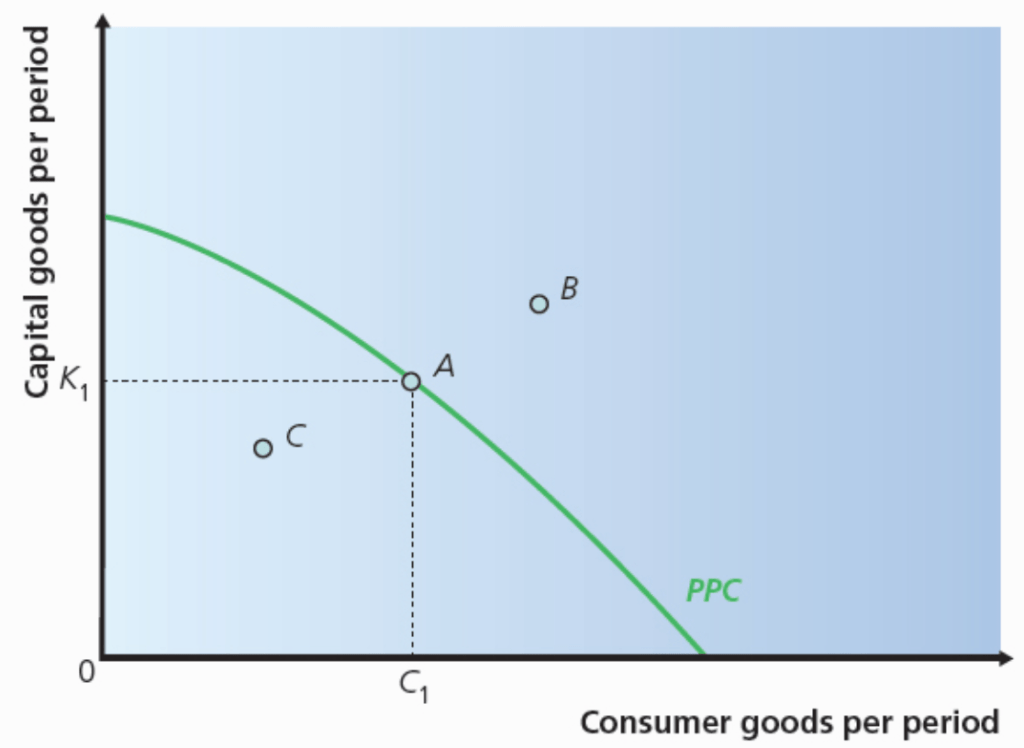
Naturally, production of capital goods can lead to economic growth, as an economy has greater potential to produce, as demonstrated by the change in production possibility curve on the graph below:
Taking into account all of the production within an economy brings us to the important metric Gross Domestic Product, which is a measure of the economic activity carried out in an economy during a given time period.
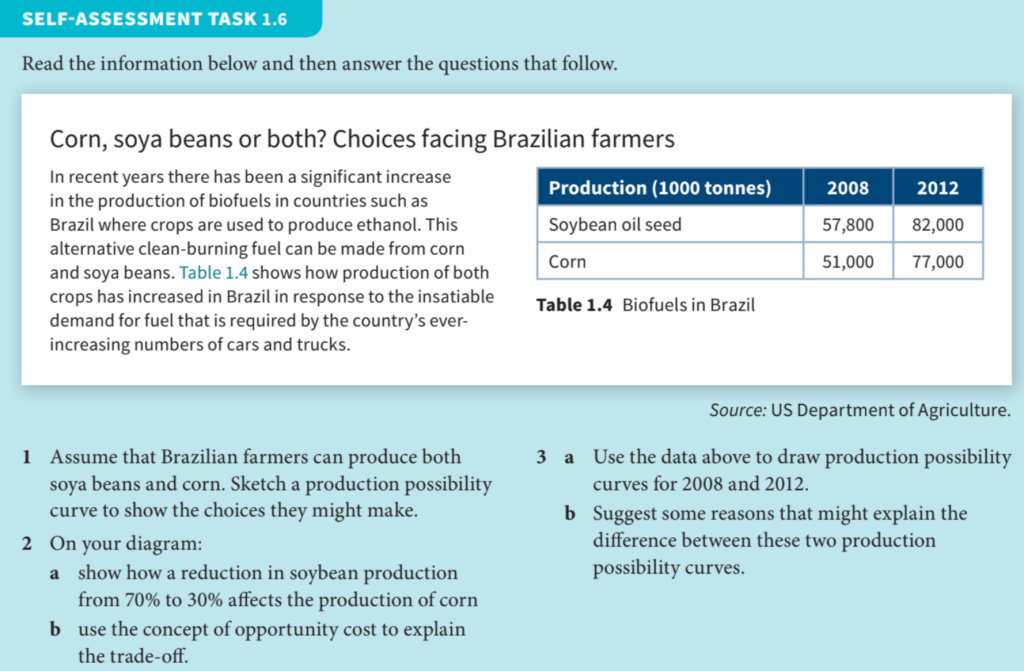
Task – Opportunity Cost