Demand
We define demand as the quantity of a good or service that consumers choose to buy at any possible price in a given period.
When we refer to demand we are typically referring to effective demand, which combines the will to buy something with the purchasing power to buy it. If a consumer doesn’t have the purchasing power, then they have only a notional demand.
The factors that affect demand can be loosely grouped into the following four categories:
- the price;
- your income;
- the price of other goods; and
- your preferences.
Market demand is the aggregate of all individuals demand, that is the total quantity of a good or service that all potential buyers would choose to buy at a given price.
In our following reasoning, we will make use of the term ceteris paribus, which means that we will often assume that all factors not under consideration remain unchanged (literally: “all things being equal”). This has its limitations, but it allows us to analyse individual determinants.
A typical demand curve decreases from left to right, reflecting the fact that the quantity of a product demanded increases as the price decreases (this is known as the law of demand, and holds true ceteris paribus).

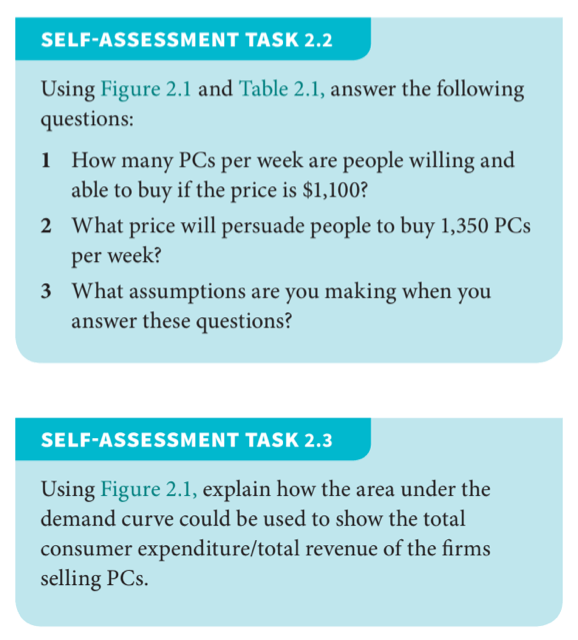
Task 1 – Interpreting a Demand Curve

Task 1 – Constructing a Demand Curve
Practice drawing a demand curve for the following data:

Real Income Effect
The real income effect of a price increase in a product refers to the fact that if a consumer buys a product at a higher price, then they will have less income left over. The fact that an increase in price might cause a consumer to buy a different product instead is known as the substitution effect.
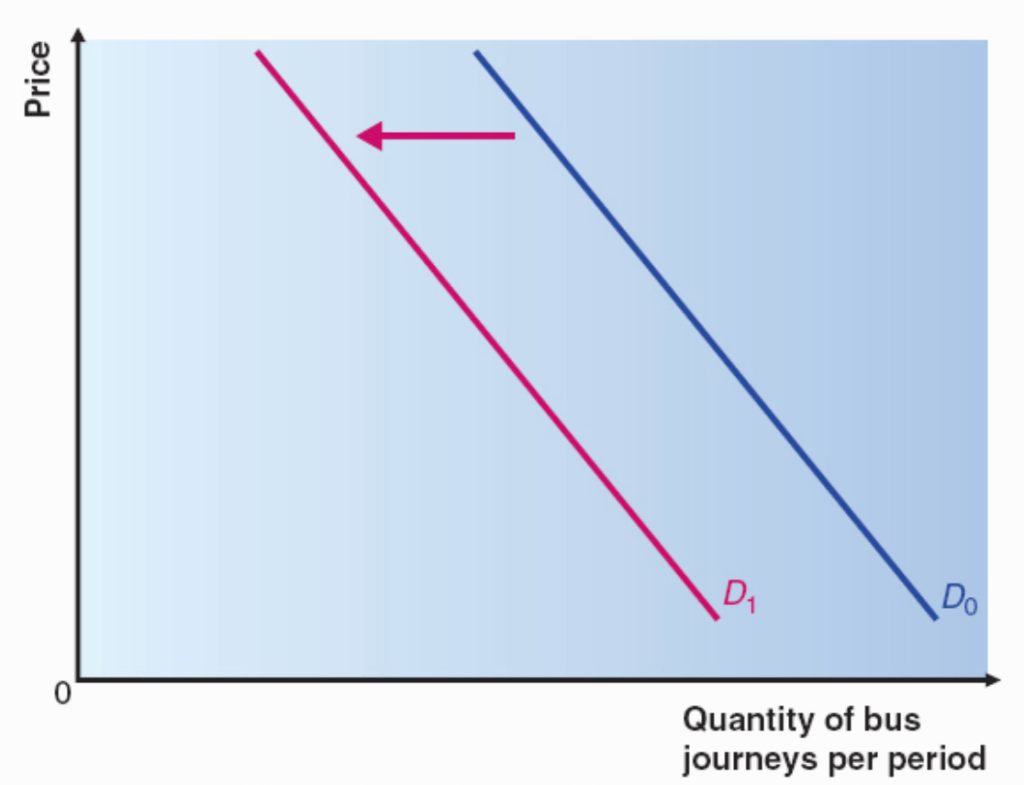
Movement ON curve vs. movement OF curve
With a demand curve, it is important to distinguish between movement along the curve and movement of the curve.
- Movement along the curve indicates a change in buying pattern of consumers in response to a price change;
- Movement of the curve indicates a change in demand due to other influences.

Task – Movement of Demand Curve

Key determinants of demand
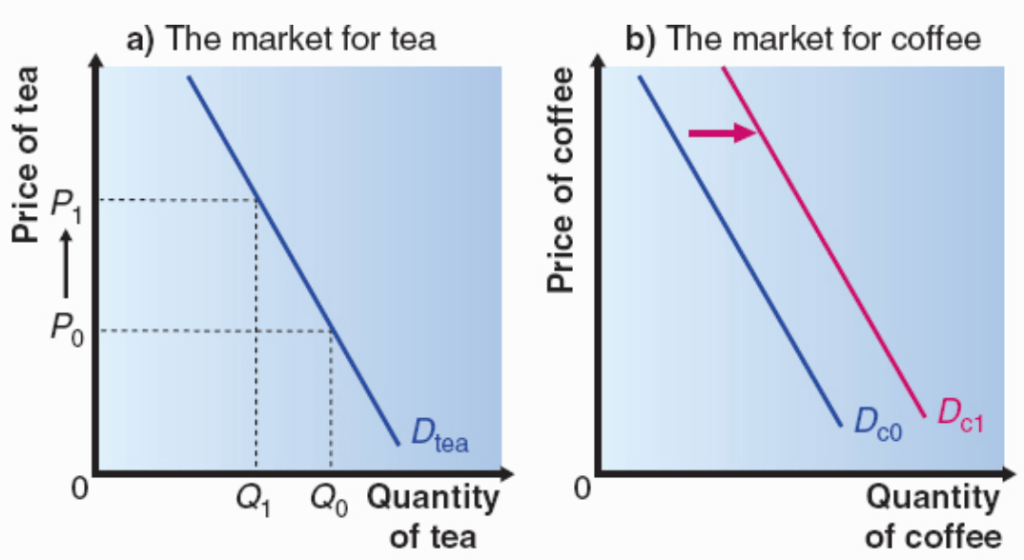
We must distinguish between normal goods and inferior goods. With a normal good, like Starbucks’ coffee for instance, the demand will increase as consumer incomes increase. With an inferior good, like Nescafe instant coffee for instance, the demand will decrease as consumer incomes increase, as consumers can afford to switch to better products. The two graphs below show these two different situations:


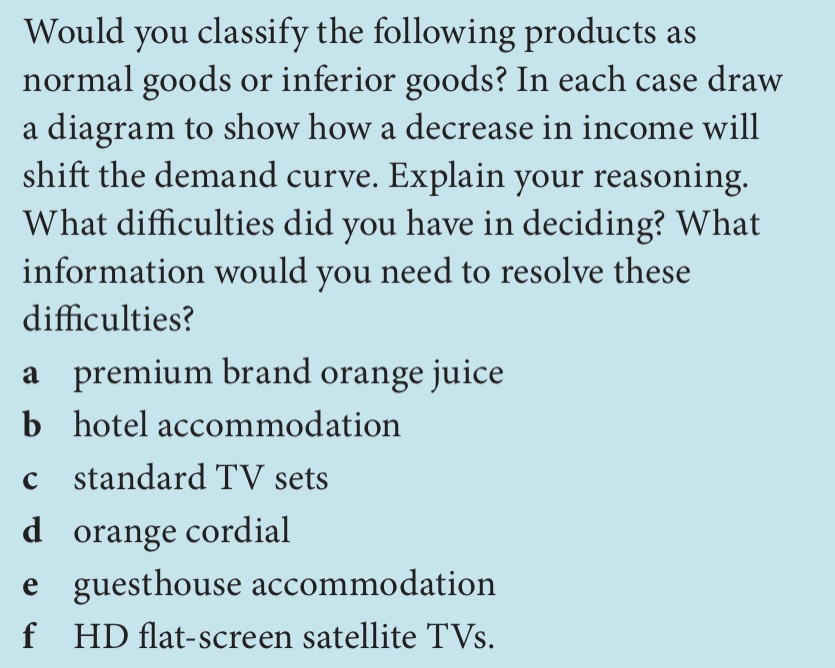
Task – Normal and Inferior Goods
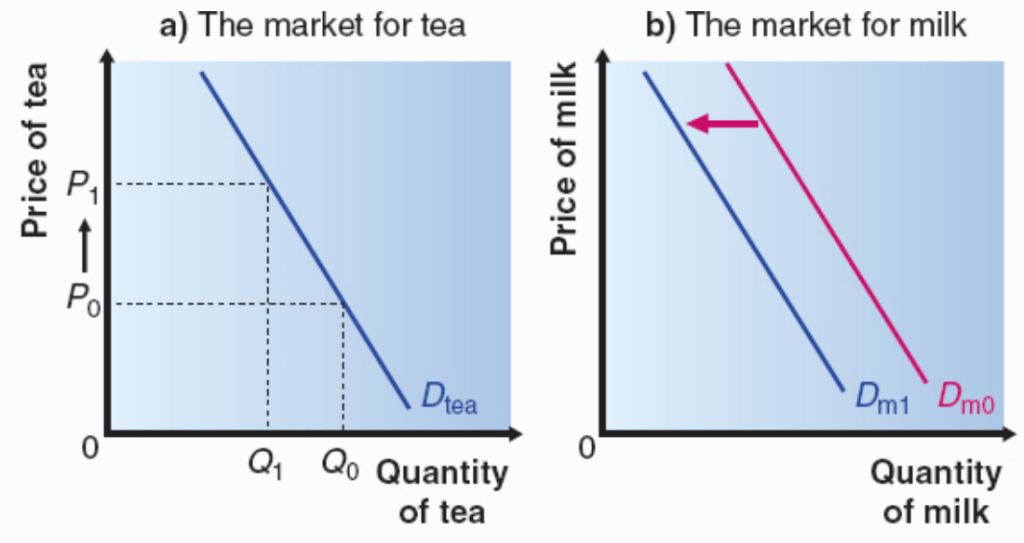
Influence of the price of other goods on demand
Other goods might be substitutes or complements. A substitute for rice would be pasta. A complement for bread would be butter.
In general, an increase in the price of a substitute good will cause an increase in the demand for a good. Conversely, an increase in the price of a complementary good will cause a decrease in the demand for a good.
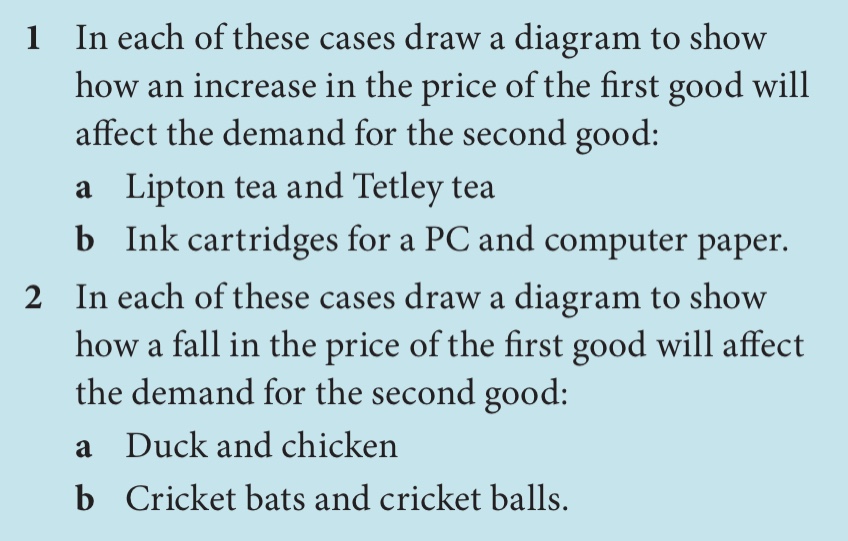
Task – Substitute Goods
Influence of consumer preferences on demand
Various other factors like advertising or fashions can cause movements in a demand curve.
Exercise

