Now that we have been introduced to supply and demand we can combine these two curves to consider market equilibrium.
Market equilibrium is a situation that occurs in a market when the price is such that the quantity that consumers wish to buy is exactly balanced by the quantity that firms wish to supply. Note that reaching market equilibrium is a dynamic process.

The graph above shows at what prices there will be excess supply and at what prices there will be excess demand. Over time, in a free market the price will converge to P* through movements along both the demand and supply curves, which is known as market equilibrium.
Task – Market Equilibrium

Consumer Surplus
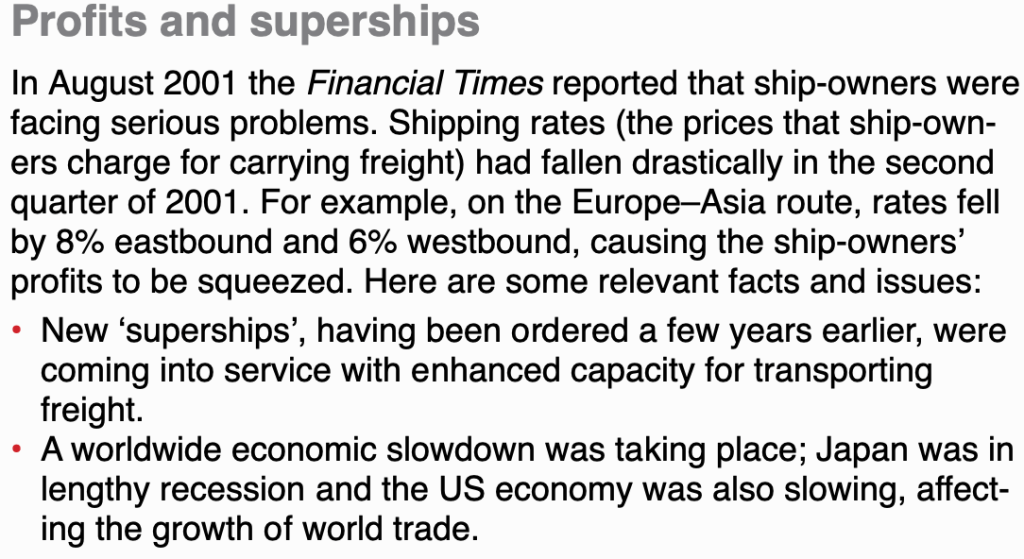
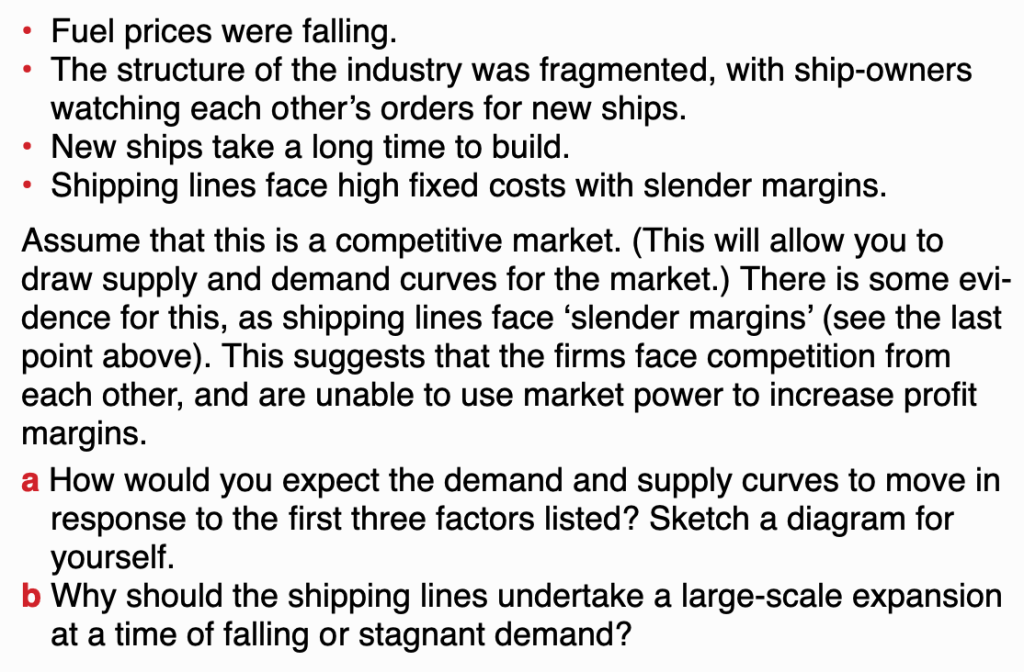
The market equilibrium price does not mean that this is the price that every consumer is willing to pay. There will be some consumers who would be willing to pay more but yet still pay the market equilibrium price. This concept is known as consumer surplus.
CONSUMER SURPLUS: The difference between the value a consumer places on the unit consumed and the payment needed to actually purchase that product (area between demand curve and market equilibrium).
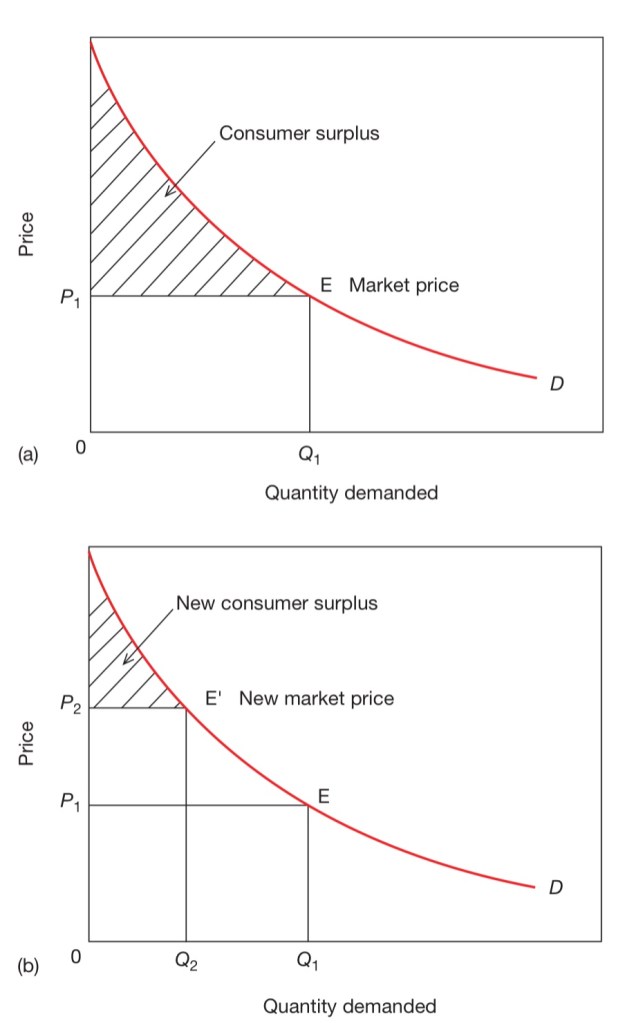
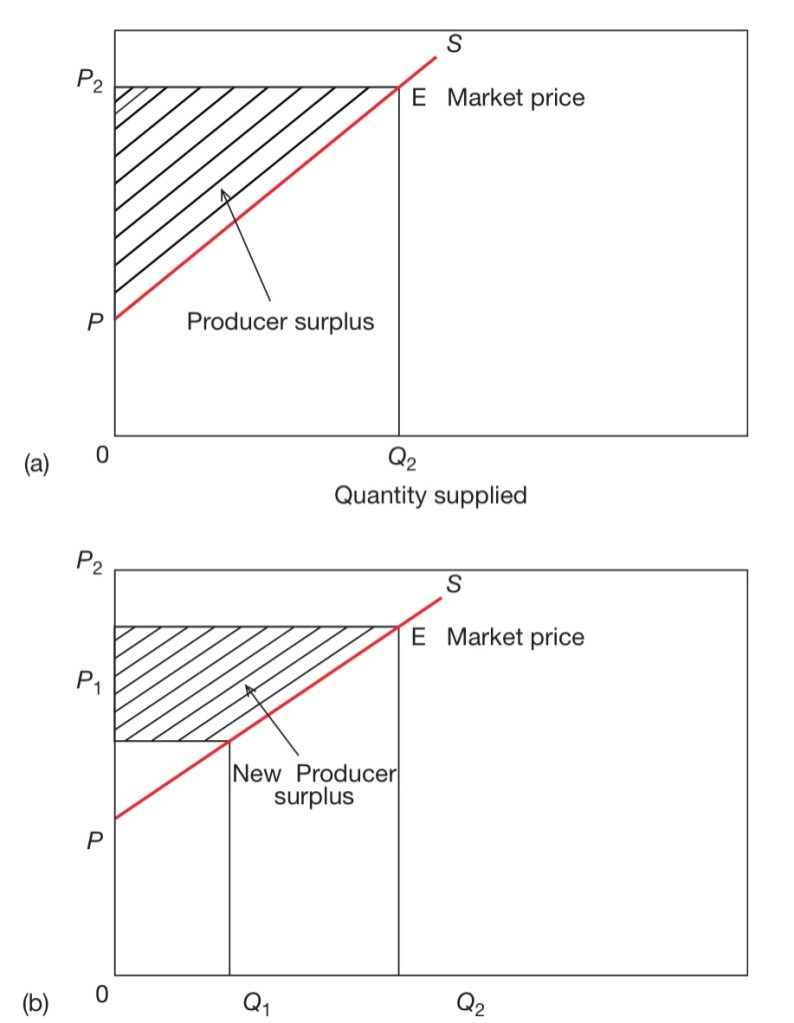
Producer Surplus
The converse situation can apply when consumers are willing to pay a higher price than producers would accept.
PRODUCER SURPLUS: Difference between the price a producer is willing to accept and what is actually paid (area between demand curve and market equilibrium).
Types of market
We have so far mostly talked about the market for products. Let’s consider some other markets:
Labour market
Firms demand labour and employees supply labour. From the firm’s perspective it is considered a derived demand, because they want the labour not for its own sake, but for the output it produces.
We can think of the wage rate as the “price of labour”. The lower it is, the more that firms will demand (an inverse relationship between price and quantity, represented by a downward slope).
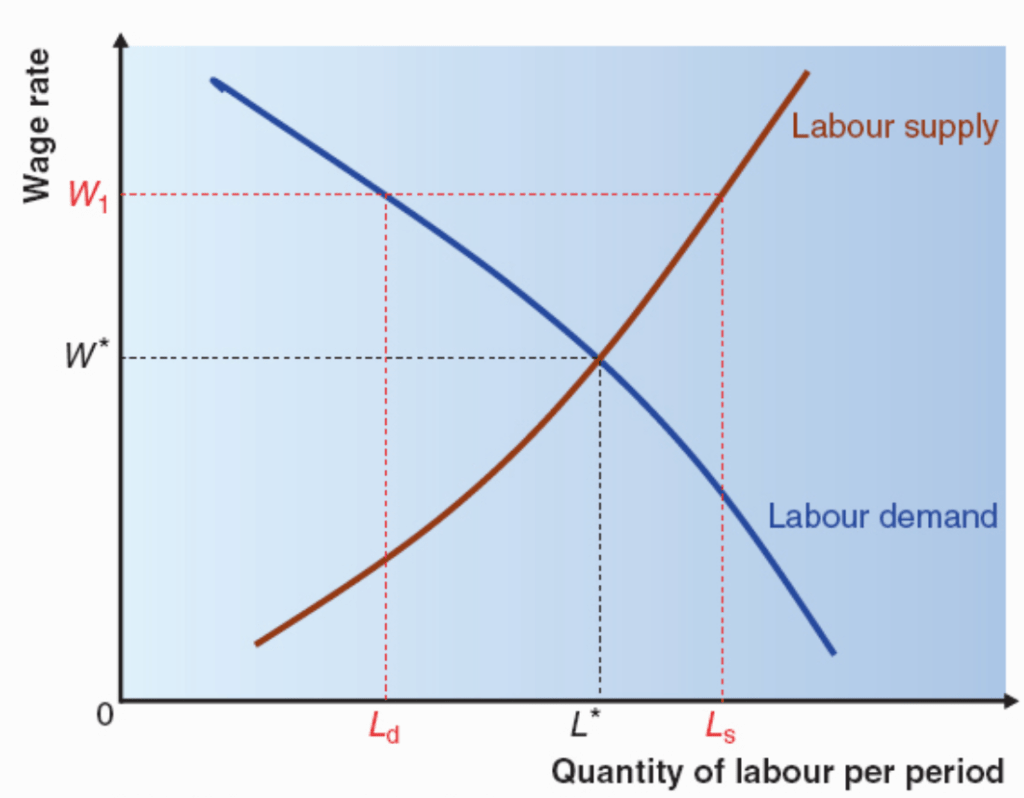
On the above diagram, setting the wage rate at W1 (above the equilibrium rate of W*) will cause more people to offer themselves for work (Ls) whilst there is less demand of work (Ld). This excess supply is one cause of unemployment.
Foreign Exchange Market
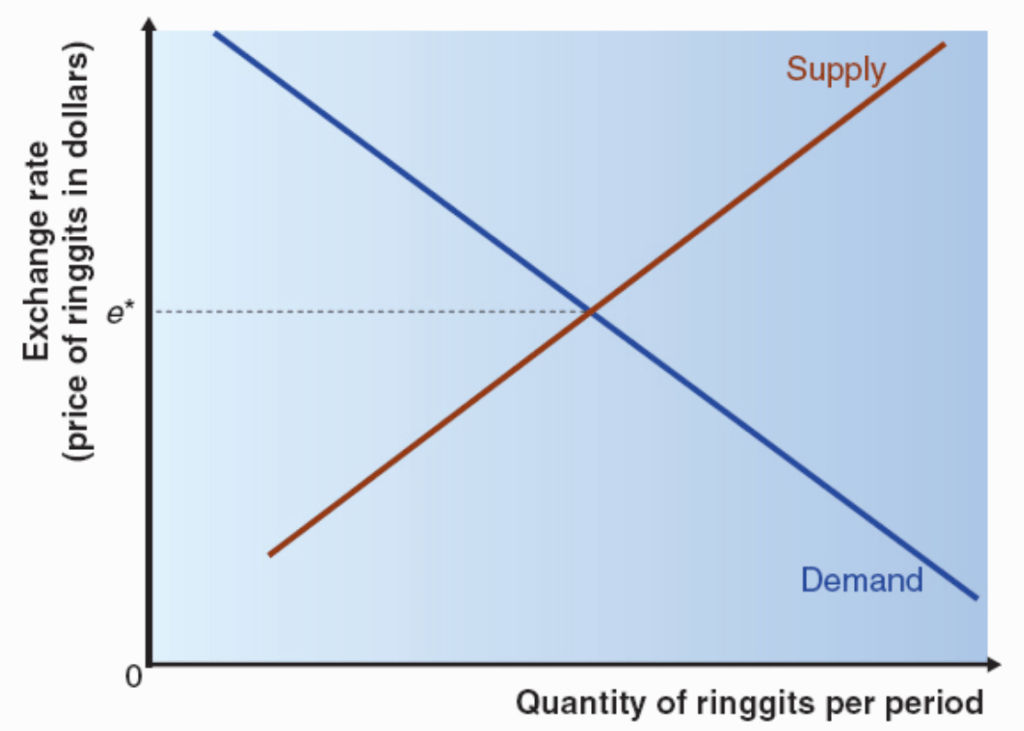
To buy things in Georgia, you need lari. To buy things in the UK, you need pounds sterling. So if a UK firm wants to buy Georgian wine, they need first to buy lari with their sterling in order to pay for it. The rate at which the can buy lari is called the exchange rate.
If the exchange rate for lari in terms of pound sterling is high, potential buyers get very few lari per pounds, and so the demand for lari will be relatively low. Hence the demand curve, as with all others looked at, is downward sloping. If the exchange rate increases, Georgians will be more happy to sell lari as they will get more pounds with which they can buy more British products, so the supply of lari will increase. The equivalent diagram for the exchange rate between US dollars and Malaysian ringitts is shown below:
Money Market
We mentioned earlier some of the functions of money, as a medium of exchange, a store of value, a unit of account, and a standard of deferred payment. Due to its functionality, there is a demand for money and so naturally there is a market for money.
The demand for money depends on several factors, especially how much money people wish to spend, which depends upon income.
The price of money can be considered in terms of opportunity cost. Holding onto (or saving) money prevents people from spending it or from buying a financial asset that offers a better rate of return. The rate of return of such a financial asset can be considered as the price of money.
We will consider the supply of money later in the course, but for now it is enough to know that is is controlled by a country’s central bank.
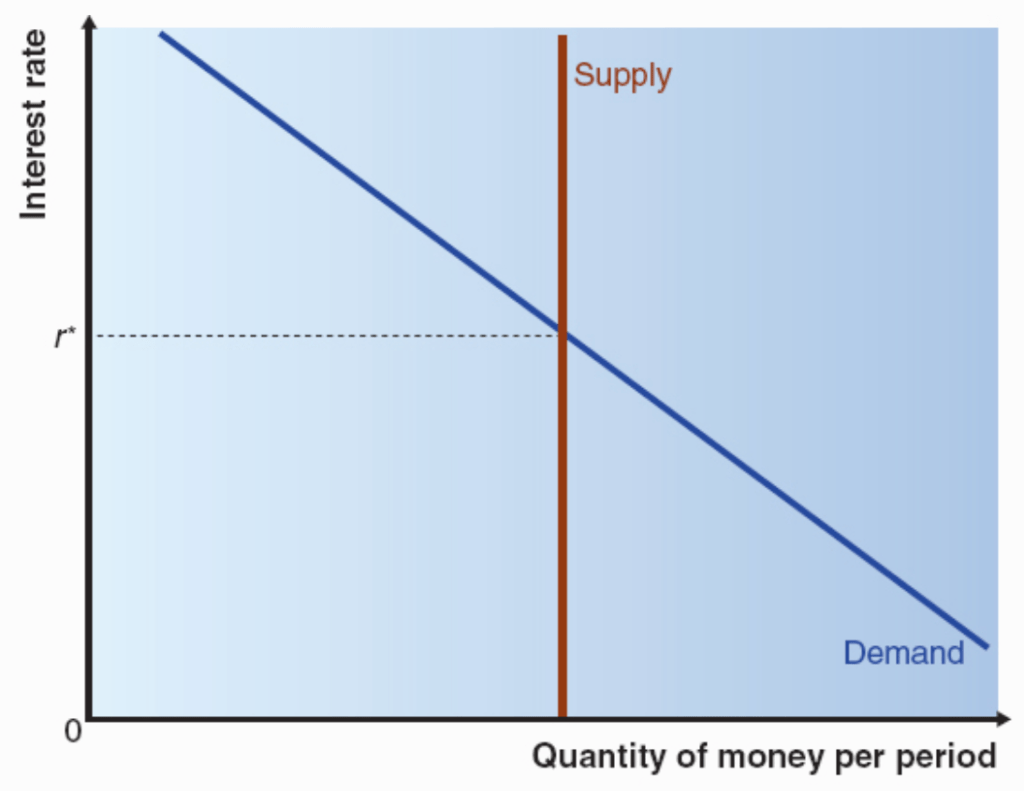
The supply of money is fixed (under our current assumptions), so an increase in the interest rate will lead to an excess in the supply of money. As the interest rate (that money can earn) decreases, the demand for money decreases.
Comparative Statics
Comparative static analysis is a key tool in the economist’s toolbox and examines the effect on equilibrium of a change in the external conditions affecting a market.
Example -> Market for instant noodles
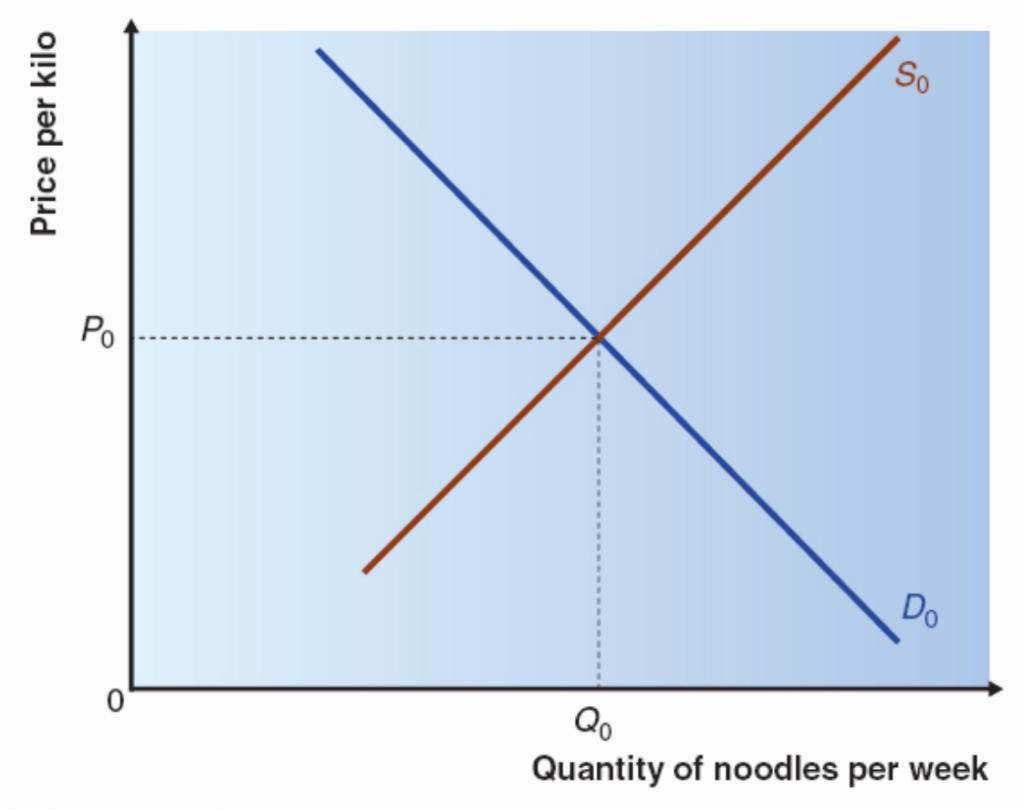
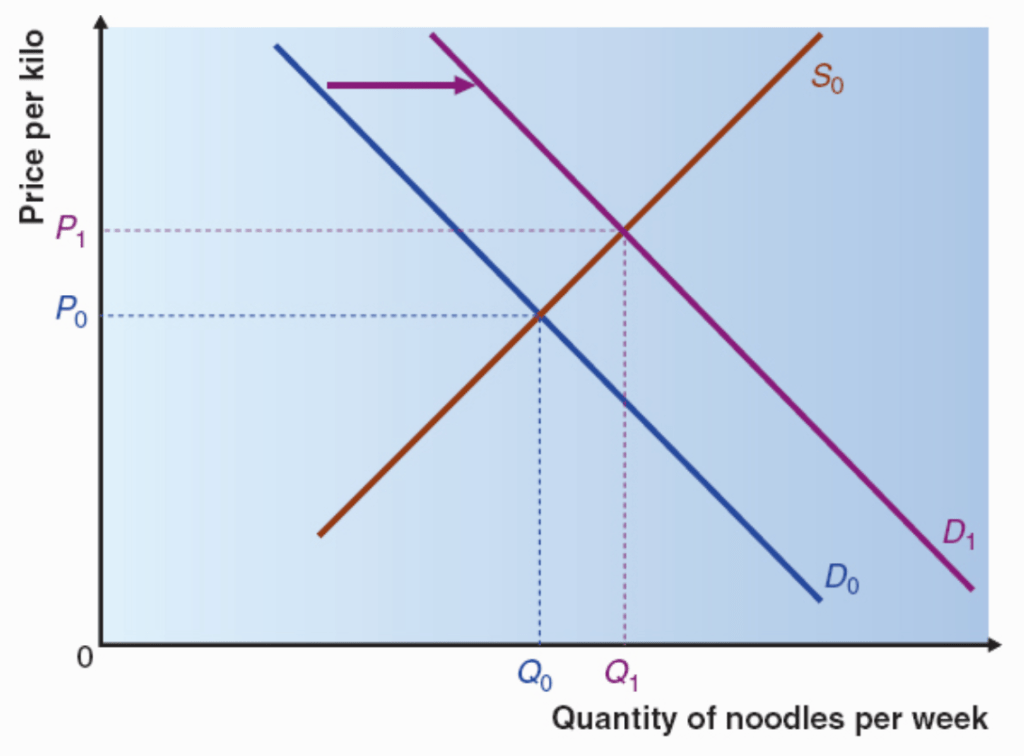
Whenever we see the subscript zero, this indicates the “before” positions prior to changing external conditions.
Let’s suppose that there was a study published showing the health benefits of eating noodles. Below we show the impact on the curves, and see the new equilibrium, with price P1 and quantity traded Q1.
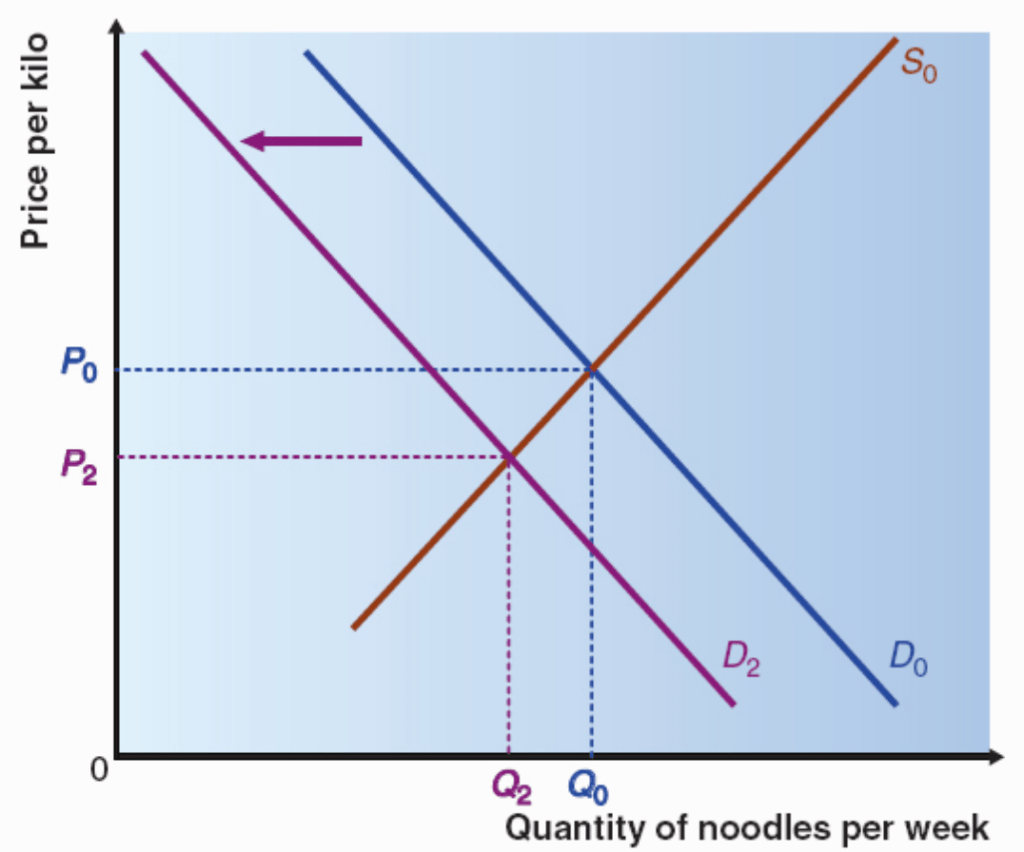
Now let’s suppose a fall in the price of fresh noodles, which can reasonably be considered a close substitute for instant noodles. Below we see the impact on our curves:
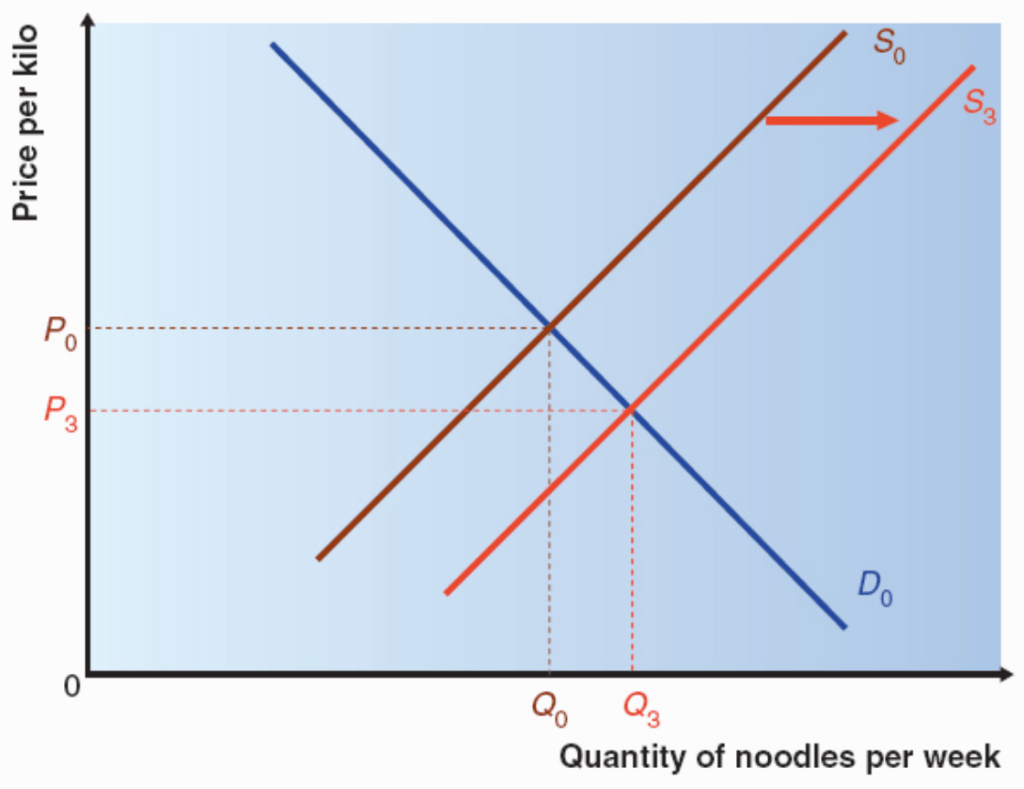
Now let’s suppose that a new noodle-making machine is developed, which enables noodles to be produced at a lower cost. The curves below show the impact:
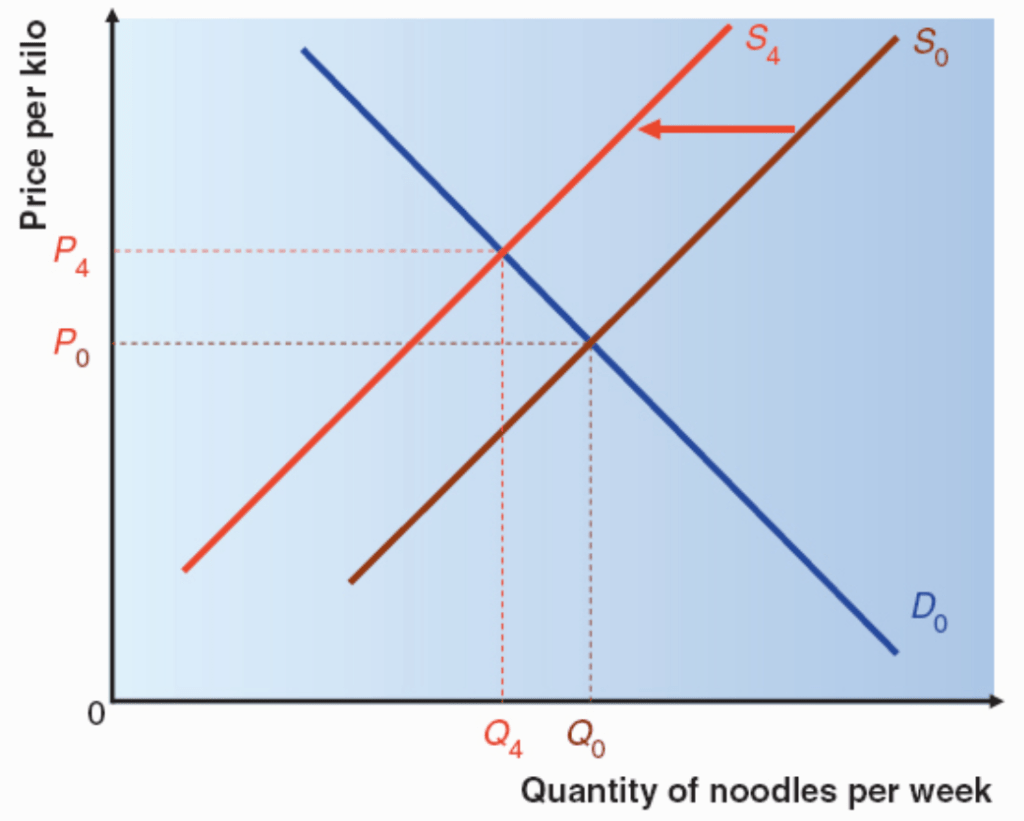
Finally, let’s imagine that the labour costs increase in the noodle factories (perhaps because of actions by unions). Below we see the impact of this on our curves:
Task – Shifting Supply and Demand curves
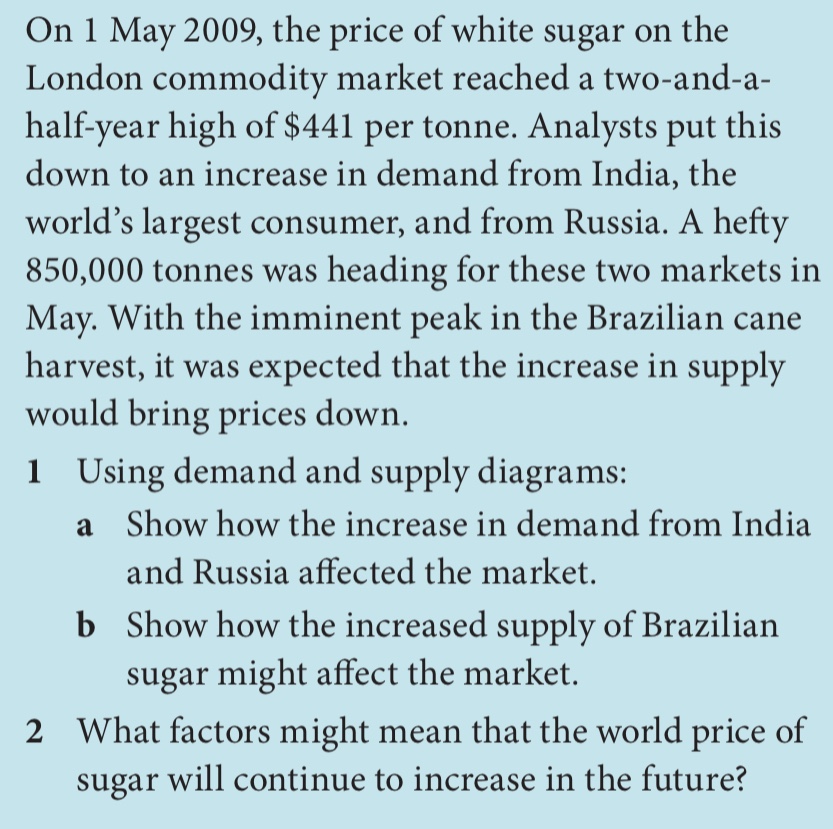
Exercise
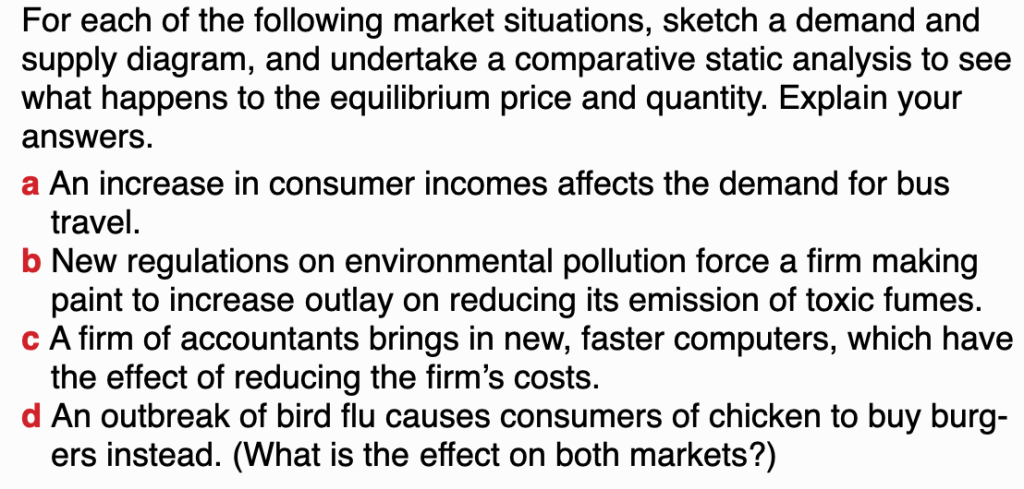
Exercise 2