To get a sense of how well an economy is performing, people monitor macroeconomic aggregates, such as total unemployment or total spending.
The following three are seen a possibly the most important indicators of a healthy economy:
- Economic growth – to be considered in much more detail in the A-level part of the course;
- Inflation rate – the rate of change of the average price level; and
- Unemployment.
It is also important to keep in mind how the economy interacts with the rest of the world, for instance through balance of payments.
Economists can rarely perform experiments, so rely on data, such as that compiled by government agencies, the IMF, the World Bank and the UN. There can be many issues about how data is compiled or precisely what it is measuring, but there is little alternative than to relying on such data, as such data is expensive and time consuming to compile.
As prices change over time, when making comparisons economists rarely use nominal values, the actual price at the time of a transaction. They typically prefer to use real values, which are adjusted for inflation.
An alternative to nominal and real values is to use an index number, which is a device for comparing the value fo a variable in one period or location with a base observation. For instance, the retail price index measures the average level of prices relative to a base period.
Example
Last year a kilogram of oranges cost £0.80. This year they cost £0.84. We can compare these periods by looking at the percentage change, or by setting an index with the £0.80 representing a base value of 1.
Exercise
Metrics used to identify the price level
The most important general price index in the UK is the Consumer Price Index (CPI), a measure of the general level of prices in the UK, used since 2004 when setting inflations targets. It is based on 180,000 individual price quotes on 680 products collected each month by the Office of National Statistics (ONS). An alternative measure, the CPIH includes housing costs incurred by owner occupiers.
We must distinguish between indices like the CPI that measure the level of prices in the economy and measures such as inflation that measure the rate of change of prices.
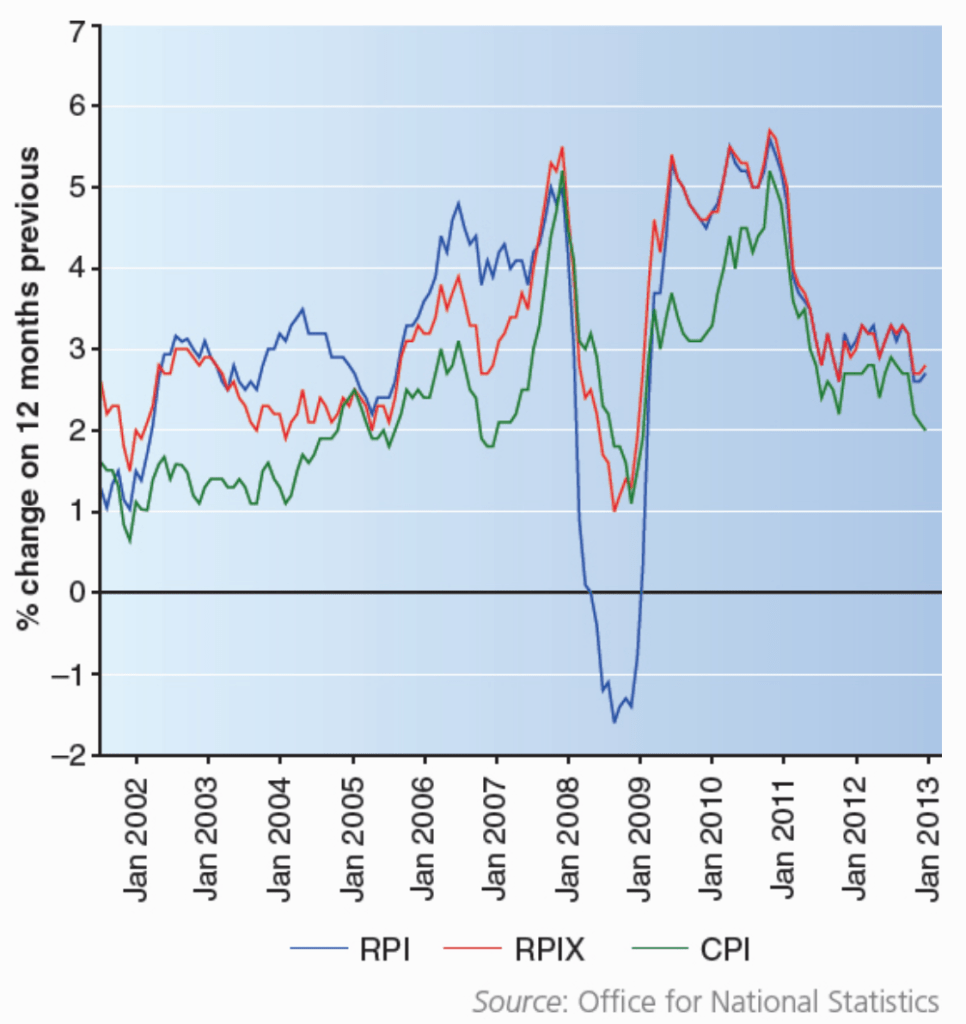
Prior the the CPI, the UK used to measure inflation based on changes in the Retail Price Index (RPI). From 1997 to 2004, when the British government first explicitly set an inflation target, it used RPIX, which is the RPI excluding mortgage interest payments. The RPI is calculated in a similar way to the CPI, but chooses a different basket of goods and services and differs in the population included in the sample and the way the calculation takes place. In general the CPI is more harmonious with indices used in other parts of Europe. Both indices have the limitation that the goods in the “basket” are fixed, so they can overstate costs by lacking the flexibility to select a cheaper substitute good when one good’s price rises. Below we see the CPI, RPI and RPIX between 2002 and 2013:
Task – Price Index
- Find out which goods and services are included in Georgia’s CPI (“Consumer Price Index”);
- For the UK, find how the basket of goods included in the RPI (“Retail Price Index”) and the CPI (“Consumer Price Index”) differ. Look at the values for each of them in recent years and note how they differ;
- Based on the kind of products you buy, design a CPI “basket of goods” for yourself that would be useful to measure how the prices of these goods were changing over time. Would it be the same for your parents? If not, make a note of what there basket of goods would be.
Inflation
Globally speaking, inflation was steady (below 10%p.a.) through most of the 1960s and the 1970s. Following the first oil-price crisis in 1973/1974 inflation increased and remained high until a period of relative stability around the end of the twentieth century. In developing countries inflation decelerated considerably from 1980 onwards. South America experienced particularly high inflation in the 1980s and 1990s, with Argentina, for instance, experiencing inflation of 3079% in 1989 and 2314% in 1990 (Bolivia’s inflation reached 11750% in 1985).
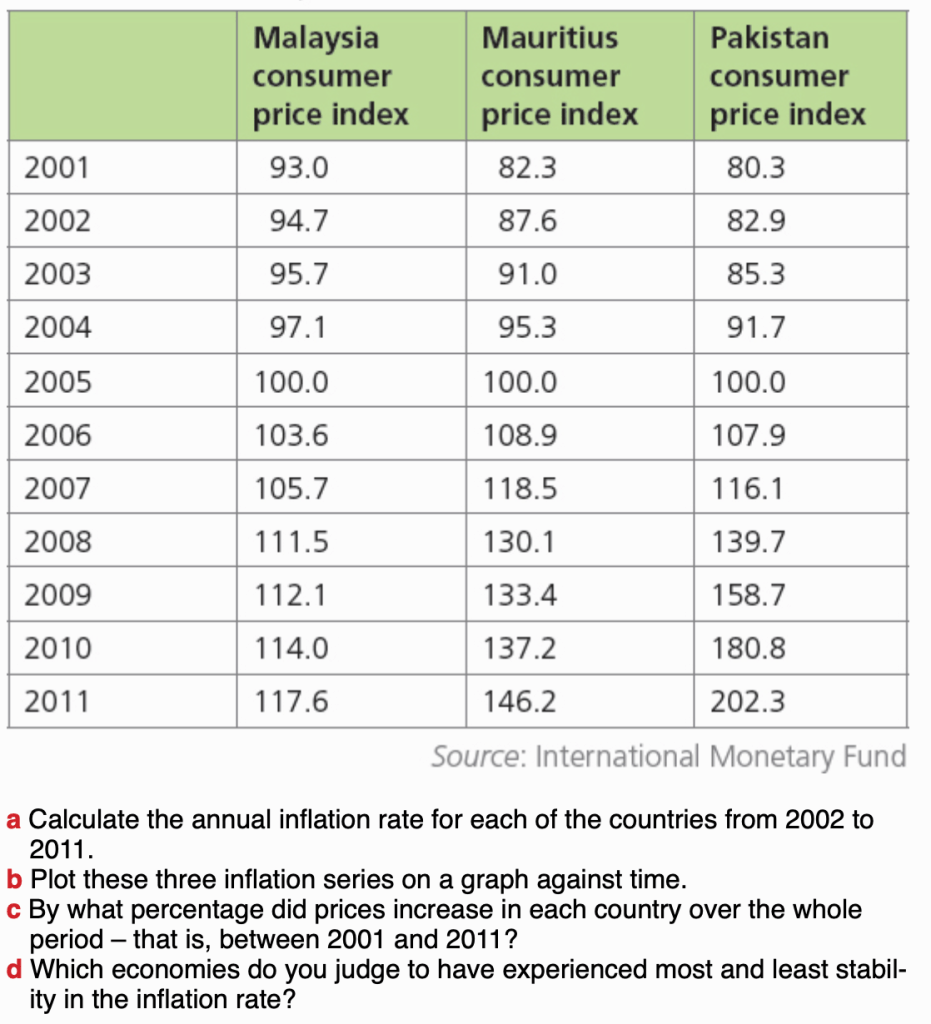
Below we can compare inflation in developing countries in Asia and in sub-Saharan Africa during the end of the 20th and beginning of the 21st century:

Note that some countries, e.g. Japan, have also experienced significant periods of deflation, where the general level of prices in the economy falls over time. (Note that disinflation is subtly different and means a fall in the rate of inflation). Deflation can have negative impacts such as increasing a country’s debt burden. Economists often talk about deflation due to an increase in aggregate supply as good deflation and that due to a fall in aggregate demand as bad deflation.
Task
- Create a presentation with the title: Inflation and Deflation in Georgia during the 21st Century. In the presentation you should:
- Summarise, with the help of a graph, the general trend of inflation so far this century, detailing any interesting fluctuations.
- Isolate any periods of deflation during this time and explain the reasons for them.
- Find out what the national bank’s current target for inflation is and compare this with other countries. explain why this rate was set and say whether you think it is reasonable.
Causes of Inflation
Let’s consider the quantity theory of money. To do this we will use the term money stock (M) to refer to the quantity of money in the economy and the term velocity of circulation (V) to refer to the speed at which the money stock changes hands. If P is the overall price level, and T is the volume of transactions in goods and services, then we define the velocity of circulation as V = PT/M.
This is normally written as MV = PT.
The Monetarist school of economists argue the V will be constant (or at least stable over time).
Based on this theory, persistent inflation can arise only when money stock persistently grows more rapidly than real output.
Cost-push inflation is inflation driven by an increase in the costs faced by firms, and so causes a shift in the supply curve, as shown below:

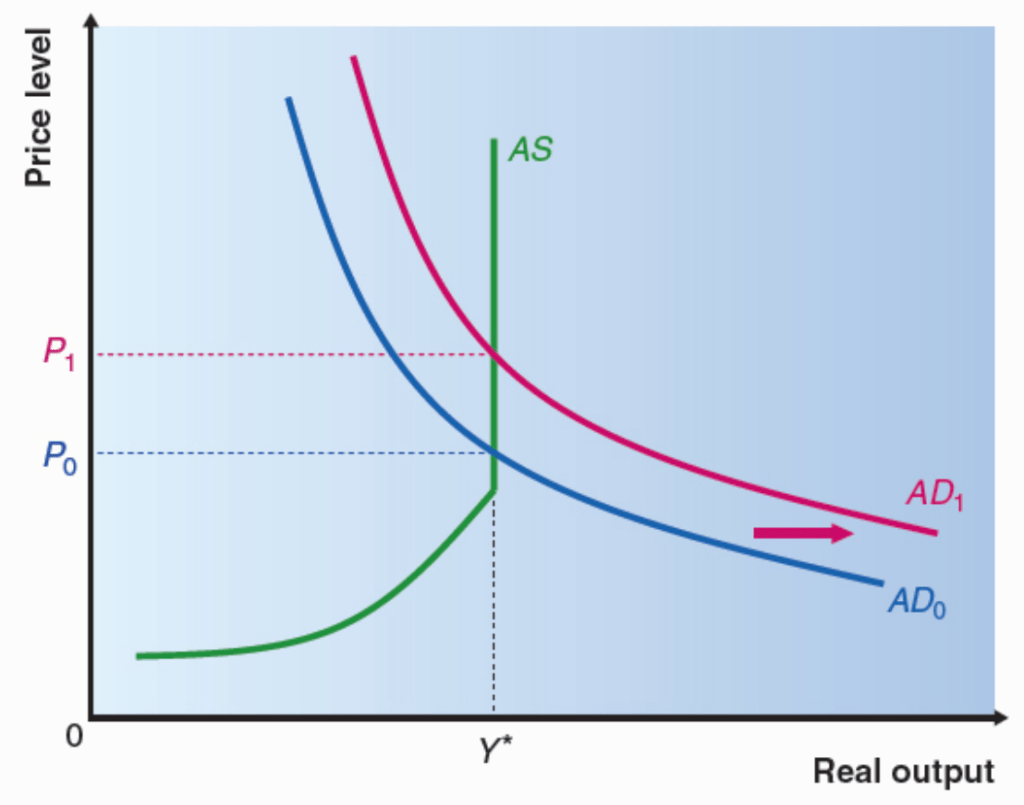
Demand-pull inflation is inflation driven by an increase in aggregate demand – especially potent at the point where the supply curve is vertical, as shown below:
Task – Causes of Inflation

Consequences of inflation
Unanticipated inflation can lead to poor decisions and inappropriately chosen investments. Less significant are the so-called “menu costs” of inflation, which are those costs involved with changing price lists. In periods of very high inflation, people try to leave their money in high-interest bearing accounts as late as possible, withdrawing the money as cash little and often, such need for ongoing withdrawals being called the “shoe leather costs” of inflation.
Hyperinflation can cause people to look for alternatives to cash, such as returning to a barter economy. Countries that have experienced hyperinflation in recent decades include Zimbabwe, Ukraine and Argentina.
Inflation can also damage the ability of price to serve as a reliable signal, leading to inappropriate use of resources and lost business opportunities.
Most governments consider management of inflation to be a central part of their macroeconomic policy and typically aim for a modest rate of inflation such as 2-3% (0% inflation is not feasible, due to time differences and differences between different sectors of the economy).
Below is a list of some of the potential drawbacks of inflation:
- Reduction in net exports;
- Unplanned redistribution of income (as borrowers gain and lenders lose);
- Menu costs;
- Shoe leather costs;
- Fiscal drag (i.e. increase in nominal income drags people into higher tax bracket than their real income warrants);
- Discouragement of investment due to uncertainty;
- Inflationary noise – bad decisions may be made as inflation clouds price signals
- Inflation causing inflation – i.e. based on expectations of future inflation workers may demand higher wages and producers may raise prices to cover higher expected costs.
Potential benefits of inflation include:
- Stimulation to output (based on expected future high sale price);
- Reduced debt burden; and
- Reduced unemployment (as real cost of labour becomes cheaper).
In general it is important to consider the causes of inflation – demand-pull is generally preferable to cost-push. Stability of the inflation rate, and its comparison with the expected rate and with the rate in other countries, are also important factors.
Task – Impact of Inflation

