Introductory Task

Utility
The term utility refers to the amount of satisfaction that a consumer receives from consuming a good or service. We try to assign numerical values to this utility. As you might imagine, the utility of a product decreases as the quantity consumed increases (you may get a lot of satisfaction from your first beef-burger of the day, but probably not so much (or any) from your twentieth).
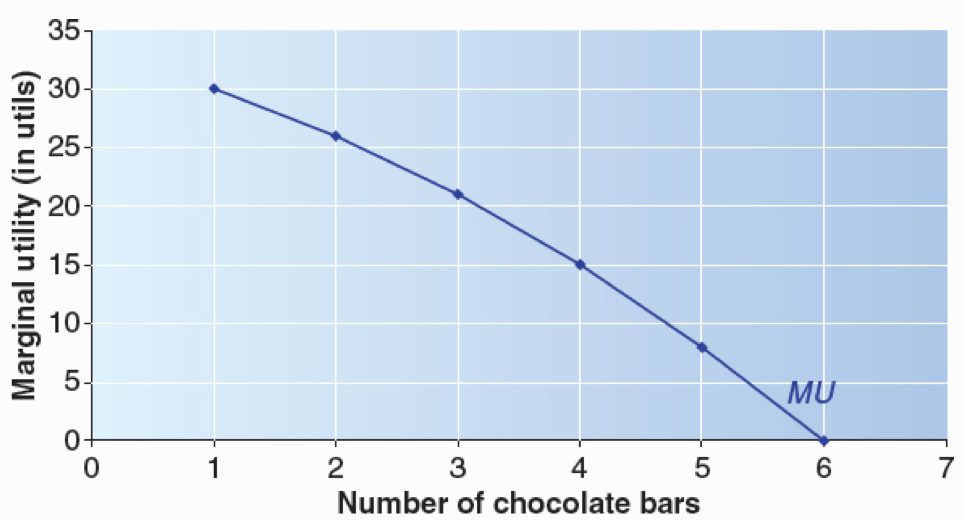
As you would expect, marginal utility means the additional utility gained from consuming an extra unit of a good or service. The law of diminishing marginal utility (exemplified above with beef-burgers) states that the more units of a good that are consumed, the lower the utility from consuming those extra units. This is why the Marginal Utility curve (MU curve) slopes downwards.
Task – Marginal Utility
Copy and complete the following table:
| Quantity | Total Utility | Marginal Utility |
| 1 | 100 | |
| 2 | 190 | |
| 3 | 250 | |
| 4 | 50 | |
| 5 | 40 | |
| 6 | 10 | |
| 7 | 7 | |
| 8 | 3 |
Marginal Utility and Demand
If we measure marginal utility in terms of money, then the MU curve becomes a person’s demand curve, as shown below. As with previous graphs looking at demand as price and quantity changes, the MU curve is interconnected with other goods. If pizzas are available at a very low price, fewer beef-burgers will be demanded at a high price.

There is an important principle called the Equi-marginal Principle, which states that for a pair of goods (X and Y) a consumer will do their best in utility terms by consuming the two goods at the point where the ratio of marginal utilities from two goods is equal to the ratio of their prices:
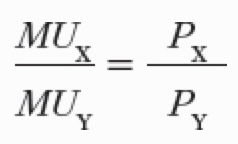
Although it increases the complexity considerably, this concept can be extended to accept for numerous goods and services.
We can rearrange the equi-marginal principle as

Let’s consider the equi-marginal principle with an example:
| Can of Coke ($1) | Slice of Pizza ($2) | |||
| MU | MU/P | Quantity | MU/P | MU |
| 60 | 60 | 1 | 21 | 42 |
| 40 | 40 | 2 | 16 | 32 |
| 25 | 25 | 3 | 12 | 24 |
| 12 | 12 | 4 | 9 | 18 |
| 5 | 5 | 5 | 7 | 14 |
| 2 | 2 | 6 | 6 | 12 |
The two goods have equal MU/P when 4 cans of coke and 3 slices of pizza are bought. No other combination of the two goods gives higher total utility, so any other combination would provide less satisfaction.
Task
Think about three things that you like buying, their prices, and how much satisfaction you expect to get from them.
- Using this information calculate MU/P for each of them.
- Compare the result with if you had just put the three items in rank order.
- Compare your results with another student and discuss any differences.
Limitations
Any measurement of MU is necessarily subjective, as clearly a vegetarian will get far less utility from a beef-burger that a non-vegetarian. Similarly, based on a person’s income, $1 has more MU for one person that it does for another. Also, considering MU over multiple goods becomes very complex, although this can be simplified by comparing the MU received from a single good with the average MU received from a “basket” of goods.
Task 1
Task 2
Budget Line
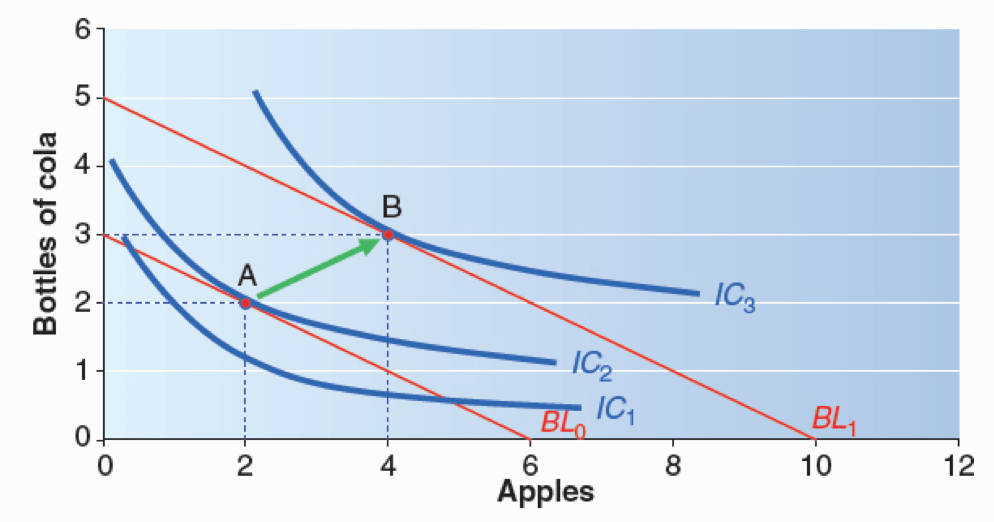
A budget line shows the boundary of an individual’s consumption set, given the amount available to spend and the prices of the goods. In the example below, an individual has enough money available to purchase 3 bottles of cola, or 6 apples, or, for instance 1 bottle of cola and 4 apples. (What curve does this remind you of?)

Indifference Curve
An indifference curve shows the combination of two goods that give equal utility to a consumer. This is also downward sloping, because greater quantities of one good can compensate a person for less quantities of another (you don’t get as many beef-burgers, but you do get to see a good movie?). Let’s consider the three possible indifference curves below:

On each curve, any position on the curve provides equal MU, but the curves to the right are preferable to those to the left as they provide greater MU at any point on the curve. Below we combine these indifference curves with our budget line:

Here we can see that the curve offering the greater utility which lies on the budget line is IC2, so the consumer should buy 2 bottles of cola and 2 apples. If income increases, she may find that the right-ward shift in his budget line is sufficient for her to be able to increase her MU to that of indifference curve 3, as show below:
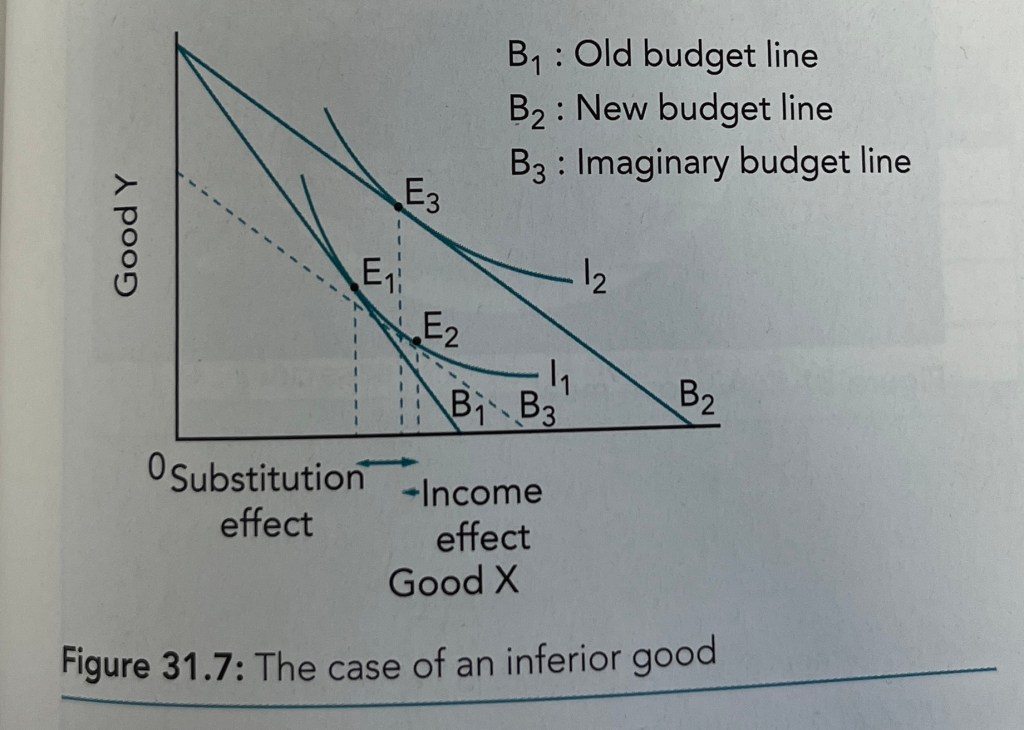
This assumes that apples and bottles of cola are normal goods, in which case he increases his consumption of both types of good when his income increases. If, on the other hand, a bottle of cola was an inferior good, the “better” indifference curves would be shaped differently, as illustrated below:

We can talk about the income effect of a price change, which is the way that a change in the price of a good affects purchasing power (i.e. real income) and the substitution effect of a price change, which is the way that a change in the price of a good affects relative prices. If two goods are normal goods, both of these effects work in the same direction. If one (e.g. apples) is an inferior good, the effects will work in opposite directions.
In the first diagram below, we see the impact of a price reduction in good X when X is an inferior good and Y is a normal good. The reduction in price pivots the budget line allowing more consumption of good X for the same amount of income, however the shape of the indifference curve means that less of good X is now consumed (this is the income effect – the impact of having more available real income) and more of good Y is consumed (the substitution effect – the extent to which the consumer prioritises one of the two good following a price change.
Below we see the impact when both X and Y are normal goods and the price of good X is increased. Here the income effect and the substitution effect work in the same direction and both reduce the amount of good X consumed, whereas the income effect decreases the amount of good Y consumed and the substitution effect counterbalances this, increasing the amount of good Y consumed. Note that the so-called imaginary budget line indicates which budget line would lead to the substitution effect without the income effect being felt.

Summary of income and substitution effects of price changes

As a reminder, Giffen goods are a special type of inferior goods for which demand falls as the price of the good falls. An example would be a staple good like rice for a low-income family. As this price of the good falls, the family buying the same amount would find that their real income had increased, as the cost was lower. This would allow them to buy more of a normal good, like meat, for instance. So they could afford to reduce a little the amount of rice they bought and use that money to buy meat as a “better” substitute for the rice they had stopped buying.
Task
Rational Behaviour
Marginal utility theory assumes that consumers behave rationally. In practice this is probably not true, and a whole field of economics, Behavioural Economics, studies the impacts of relaxing this assumption and considering some of the psychological underpinnings of non-rational behaviour (i.e. behaviour that doesn’t maximise a person’s utility).
Here are some of the key concepts in behavioural economics that challenge the classical economics models:
- Bounded Rationality: Due to insufficient information available to the consumer, or insufficient time to scale through the available information, consumers make decisions that are sub-optimal but sufficient (e.g. satificing)
- Heuristics: Consumers use ‘rules of thumb’ to make decisions which are quicker, but not always ideal, e.g.
- Anchoring – We give extra credit to the first piece of information we receive when making a decision;
- Availability – We often make decisions based on the information which is easiest to recall;
- Representativeness – We base decisions on past experience and assumptions, sometimes leading to stereotyping (i.e. decisions based on a small sample of individuals observed.
- Framing: Decisions can be affected by the way a sale is “framed”, i.e. we may be more tempted to buy a product that has been reduced from £400 to £200 than a product whose original price is specified as £200
- Endowment Effect: People often require a higher value to give away something they own than they would be willing to pay to buy the same product
- Loss Aversion: Decision making is greater affected by possible losses than it is by possible gains of the same value.
- Reference points: Decisions are typically based in comparison to a person’s current position, rather than looking at the bigger picture
- Certainty: Consumers overvalue certainty, for instance compared with a better alternative with a very high probability of being received that is not certain.
- Over-optimism: Investors are often over-confident about potential gains and don’t fully consider the potential down-sides.
- Too much choice: Traditional economic theory suggest that more choice is always a good thing, however there is evidence that it can be an impediment to effective decision making.
- Herd instict: Consumers decisions are often influenced by their peers or role models.
Behavioural economics is typically based on experiments and insights from philosophy. Some criticise the findings as being based on a small number of studies typically involving students making hypothetical decisions that may not reflect how they would make decisions in real life. The theories have also been criticised as very specific to product and difficult to generalise to all consumer behaviour.
Task 1 – Behavioural Economics
- Identify four individual decisions or purchases that you made in the last week which could be considered as irrational;
- Produce a presentation explaining the extent to which these irrational decisions or purchases could be explained by behavioural economics.
Task 2 – Behavioural Economics
In groups discuss the extent to which the following decisions represent rational behaviour and whether they can be explained in terms of traditional economic models or behavioural economics:
- Mike donates £1000 to charity;
- Suzie continues to pay an extended warranty to cover repairs to her washing machine even though a brand new one could be bought for £200;
- Liza continues to hold on to shares even though their price is falling and unlikely to rise in the foreseeable future;
- Ifzal makes a 30km round trip to fill up her car with fuel at a petrol station which sells petrol for 2 pence less per litre than the garage 100m from her house;
- A trade union takes its members on strike in a dispute over a company’s decision to remove a range of workers’ benefits, because the company can no longer afford them, even though this industrial activity risks pushing the company into bankruptcy.
