A reasonably large sample chosen at random from a a large population can be considered to be representative of the characteristics of the population.
Whether or not sample statistics, such as the mean, are reliable estimates of the population parameters depend upon:
- The nature of the sample;
- How representative the sample is of the population;
- The size of the sample;
- The variability of the population data.
If a sample over-represents or under-represents one of more characteristics of a population, then it may introduce bias. The sample is then called unrepresentative.
The most basic acceptable way to take a sample is random sampling, in which every possible sample of a given size is equally likely to be chosen. Sometimes this cannot be achieved, perhaps because the whole population can’t be identified or accessed, which leads to selection bias, which is the unintentional selection of one group of a population over another group.
The complete list of all items in the population is called the sampling frame. Once the sampling frame is known, a random number can be generated in order to select each member of the sample from the population.
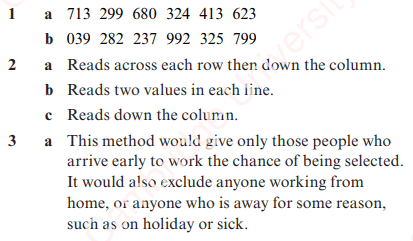
Exercise 1


Exercise 1 – Answers

Distribution of Sample Means
If you choose different samples from the same population, their means will typically not be identical, although they will probably be similar.
We can consider the sample means as a random variable with a distribution.
If the sample is random and consists of n observations of a random variable X, then:

N.B. The brackets notation above is simply to show how many were in the population that the sample mean was taken from.
Worked Example 1
- Show that for samples of size 1 drawn from a fair six-sided die numbered 1, 2, 3, 4, 5, 6,
and
- Work out
and
.

The Central Limit Theorem (CLT)
For large sample sizes, the distribution of a sample mean is approximately normal. This normal distribution will have mean 

Regarding how large n has to be, if n>50 then the CLT can be used regardless of the underlying distribution. If the underlying distribution is approximately normal, then smaller values of n can be acceptable.
Worked Example 2
The masses of a variety of apples are normally distributed with mean 45g and variance 52g2. The apples are packed in bags of six. Find the percentage of bags of apples with a total mass or more than 300g.
Worked Example 3
During an exercise session, people drink, on average, 500ml of water with a standard deviation of 50ml. 25 people are participating in the exercise session. 13 litres of water are available. What is the probability that the available water will suffice?
Worked Example 4
A continuous random variable, X, has probability density given by:

Calculate the probability that the mean, 

Worked Example 5
An IT security firm detects threats to steal online data at the rate of 12.2 per day. The threats occur single and at random. A random sample of 100 weeks is chosen. Find the probability that the average weekly number of threats detected is less than 86.
Worked Example 6
The random variable X ~ B(60,0.25).
The random variable 

Exercise 2

Exercise 2 – Answers

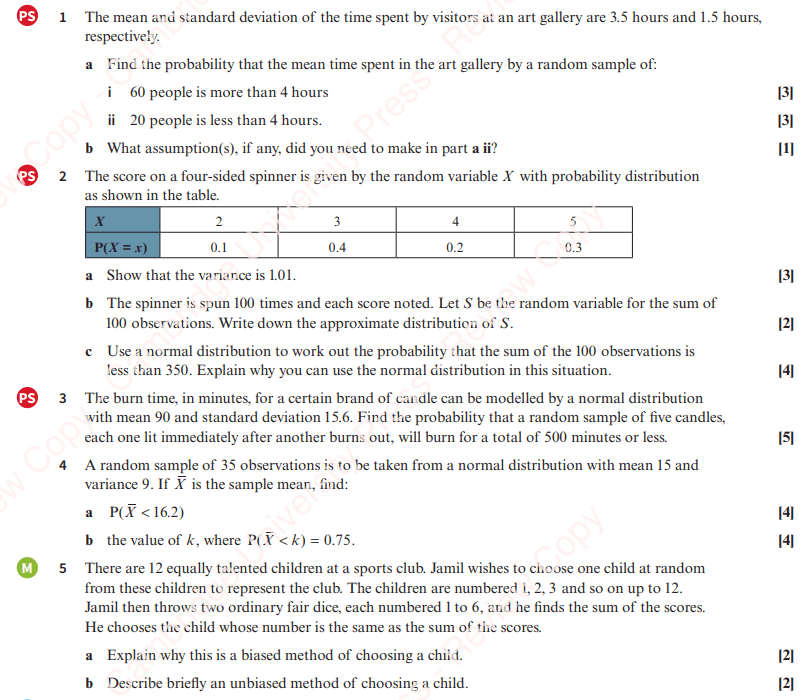
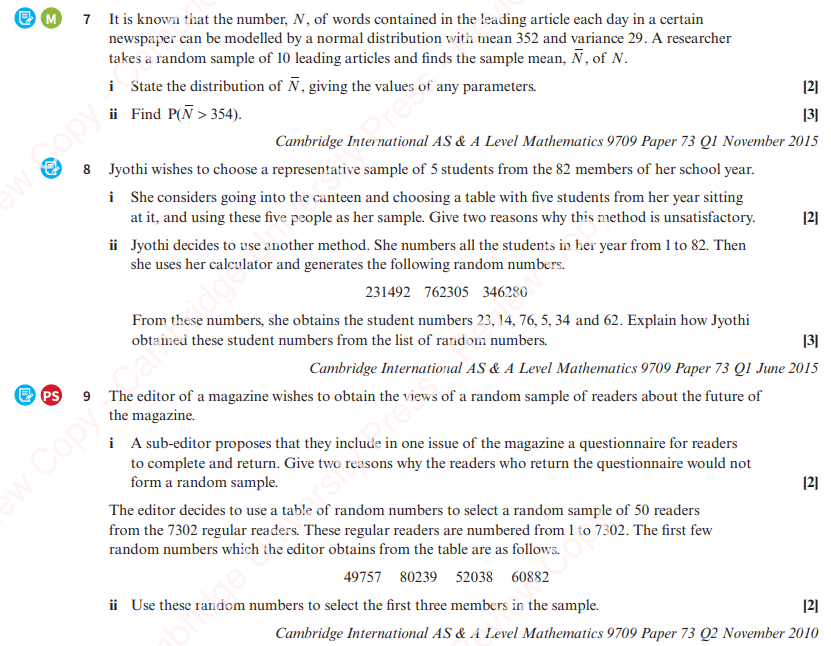
Miscellaneous Exercise


Miscellaneous Exercise – Answers


