In S1, we looked at discrete probability distributions, including the binomial distribution, which has a fixed number of trials each with only two outcomes, and the geometric distribution, also with only two outcomes, but with the number of trials not fixed and continuing until the first success.
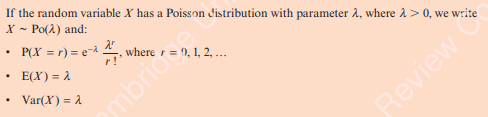
The Poisson distribution is relevant when we are interested in a rare outcome that occurs singly, independently and at random within a fixed interval (of time or space). It works particularly well when the mean and the variance both have similar values.
Generally, Poisson distributions assign high probabilities to an event occurring a small number of times and very low probabilities to the event occurring a large number of times.
Worked Example 1
Calls received at a single desk in a call centre are modelled by a Poisson distribution with a mean call rate of 6 per minute. Calculate the probability that in a given minute there will be:
- Nine calls;
- Three or fewer calls;
- More than one call;
- At least one call.
Worked Example 2
A typist makes on average five errors per page of typing
- State the assumptions made to model the average number of errors per page as a Poisson distribution;
- In a book with 200 pages, on how many pages would you expect to find, at most, 2 errors?
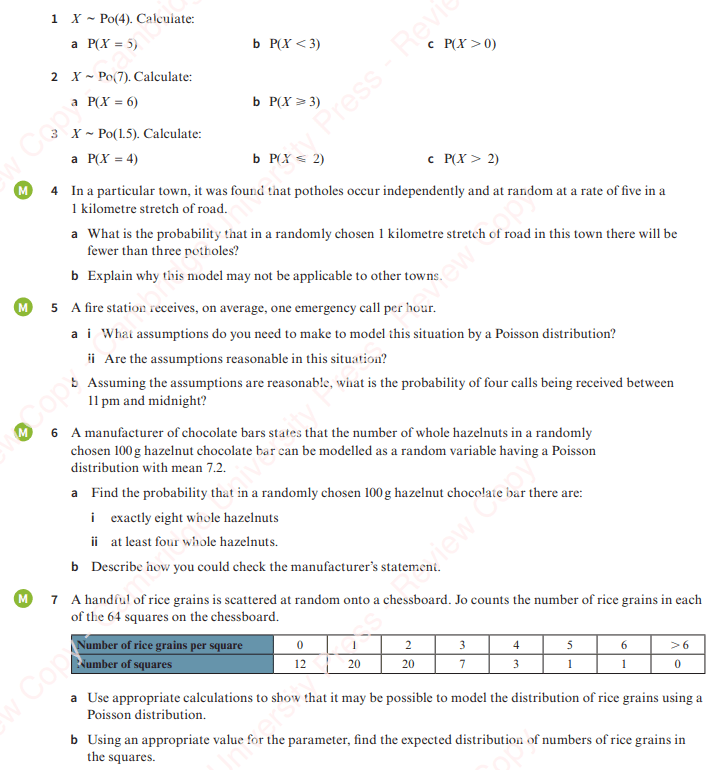
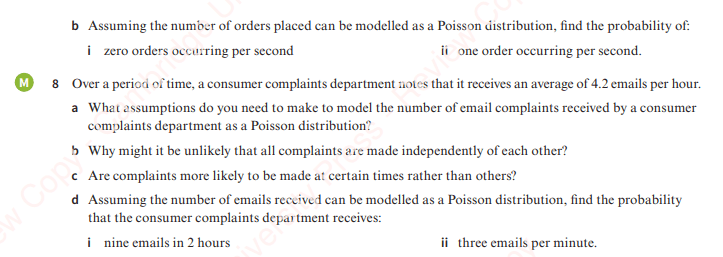
Exercise 1
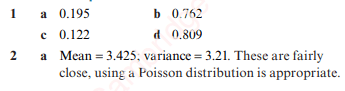
Exercise 1. Answers

Adapting the Poisson distribution for different intervals.
In a Poisson distribution events occur at a constant rate, so the mean average number of events in a given interval is proportional to that interval (i.e. we just scale the value up or down accordingly).
Worked Example 3
People arrive at random and independently at a post office at an average rate of two people every 5 minutes. Work out the probability of:
- Three people arriving in a ten minute period;
- More than four people arriving in a half hour period;
- Five people arriving in a four minute period;
- One person arriving in a one minute period.
Worked Example 4
On a typical week the number of breakages at a restaurant can be modelled as a random variable having a Poisson distribution with mean 0.8.
- Work out the probability of the following:
- Exactly one breakage in 1 week;
- Exactly one breakage in a randomly chosen 3 week period.
- The restaurant owner offers employees a bonus if there are no breakages in 6 consecutive weeks. What is the probability that they will receive a bonus?
Exercise 2

Exercise 2. Answers

Using the Poisson distribution as an approximation to the binomial distribution
Suppose we identified that a typist made and average of 4 errors per minute. There errors could be represented by Poisson distribution Po(4).
If we split 1 minute into n different sub-periods of time such that there could only be one or zero errors within each of these sub-periods of time (eg. n=60), then the probability of an error within each of these sub-periods of time (i.e. seconds) would be 4/n.
We can model each second as having only two possible outcomes, either one error or zero errors and use the Binomial Distribution Bi(n,4/n) as an approximation to Po(4). The mean is n x 4/n, i.e. 4 and the variance is n x 4/n x (1 – 4/n), which tends towards 4 for very large n, hence the variance is also 4 as per the Poisson distribution.
Summary
For a binomial distribution with large n and small p (i.e. a rare event), such that np is not large (use n>50 np < 5), the Poisson distribution with mean np can be used as an approximation for the binomial distribution.
Worked Example 5. Electrical components
A company produces electrical components. Past records show that the proportion of faulty components is 0.4%.
Suzy Q buys a box of 1000 electrical components. Using a suitable approximation, work out the probability that more than five components are faulty.
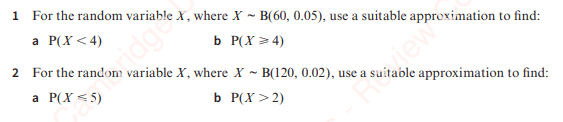
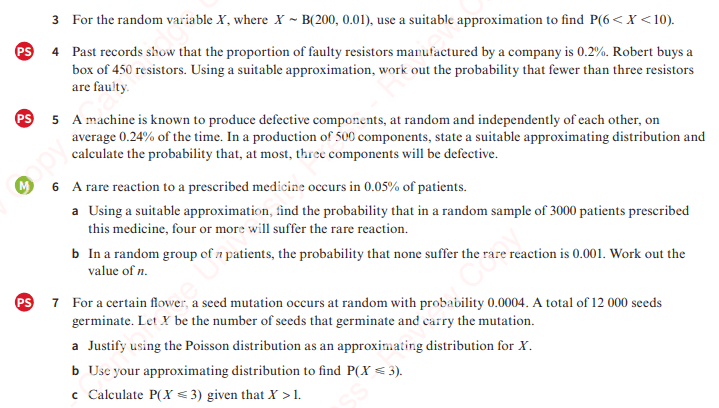
Exercise 3
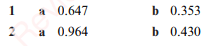
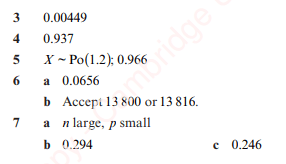
Exercise 3. Answers
Thinking back to our example of a typist making 4 errors per minute. We described n to be the number of intervals we break our minute up into. Calling the random variable X the number of errors per minute, we have X ~

As n increases, this tends towards
In general 

Hence, if r is the number of errors, 

Using the Normal distribution as an approximation to the Poisson distribution
We can use a normal distribution (a continuous distribution) to approximate to the Poisson distribution (a discrete distribution), as, although the Poisson distribution graph is always skewed, for larger values of the mean its shape resembles the shape of a normal distribution. We need to apply a continuity correction though (as we used in S1).
Conditions for using the Normal distribution as an approximation
If 
Worked Example 6
A biologist has identified over many years that a certain kind of turtle lays an average of 60 eggs in each nest.
The number of eggs laid in each nest follows a Poisson distribution and is independent of the number of eggs laid in other nests.
Calulate the probability that in a randomly chosen nest there are:
- Exactly 50 eggs;
- Over 74 eggs;
- 40 eggs or fewer.
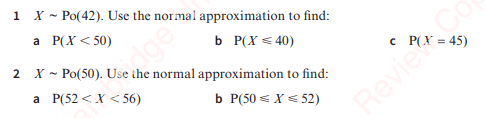
Exercise 4

Exercise 4. Answers

Hypothesis Testing using the Poisson Distribution
Worked Example 7
Records indicate that 1% of the population has a positive reaction to as test for a particular allergy.
In a village, 120 people are tested and 4 people have a positive reaction. Test at the 5% level of significance if there is any evidence of an increase in the population with a positive reaction for this particular allergy.
Worked Example 8
Accidents on a stretch of road occur at the rate of seven each month.
New traffic measures are implemented to reduce the number of accidents. In the following month there are only two accidents.
- Test at the 5% level of significance if there is evidence that the new traffic measures have significantly reduced the number of accidents;
- Over a period of 6 months there are 32 accidents. The local council claims that the new traffic measures are no longer reducing the number of accidents.
- Test this claim at the 5% level of significance;
- What would your conclusion be if you tested the claim at the 10% level of significance?
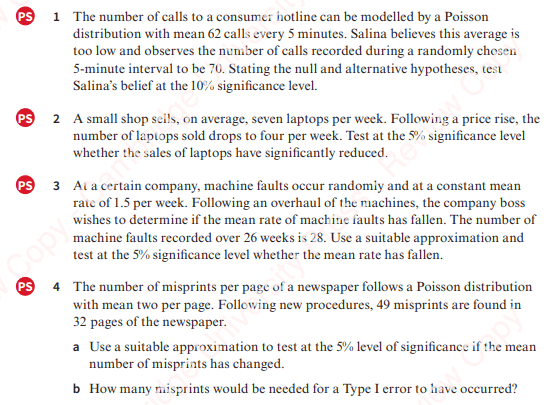
Exercise 5
Exercise 5. Answers

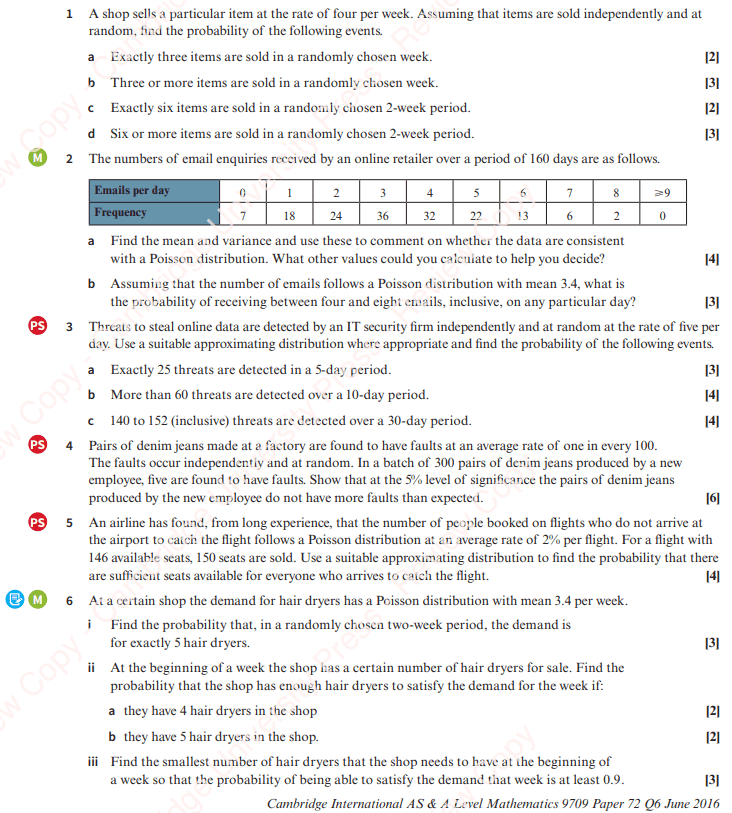
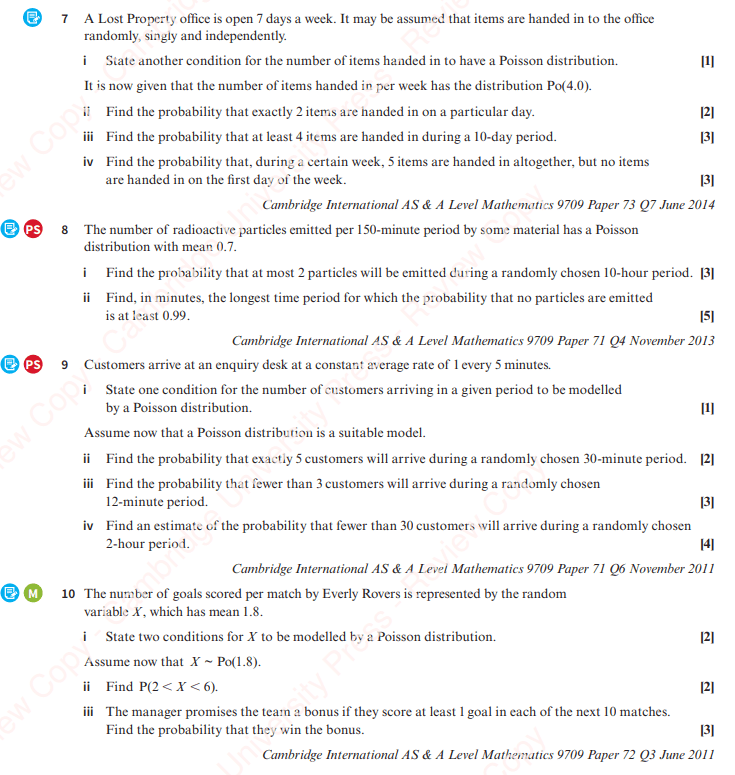
Miscellaneous Exercise
Miscellaneous Exercise Answers