Introduction to Hypothesis Testing
Suppose we roll a dice and 1/7 of the time it lands on the number 3. Is this probability far enough away from 1/6 for us to consider the dice biased? This is the kind of question we use hypothesis testing to answer.
Let’s start by considering how many 3s we would expect to see if we rolled a dice 16 times. The number clearly is between 0 and 16 and we can calculate the the theoretical probability for each of these, as we have a binomial distribution with n=16 and p=1/6.
The probability of getting 0, 1, 2, 3, 4 and 5 3s is shown below, along with the corresponding cumulative probabilities:
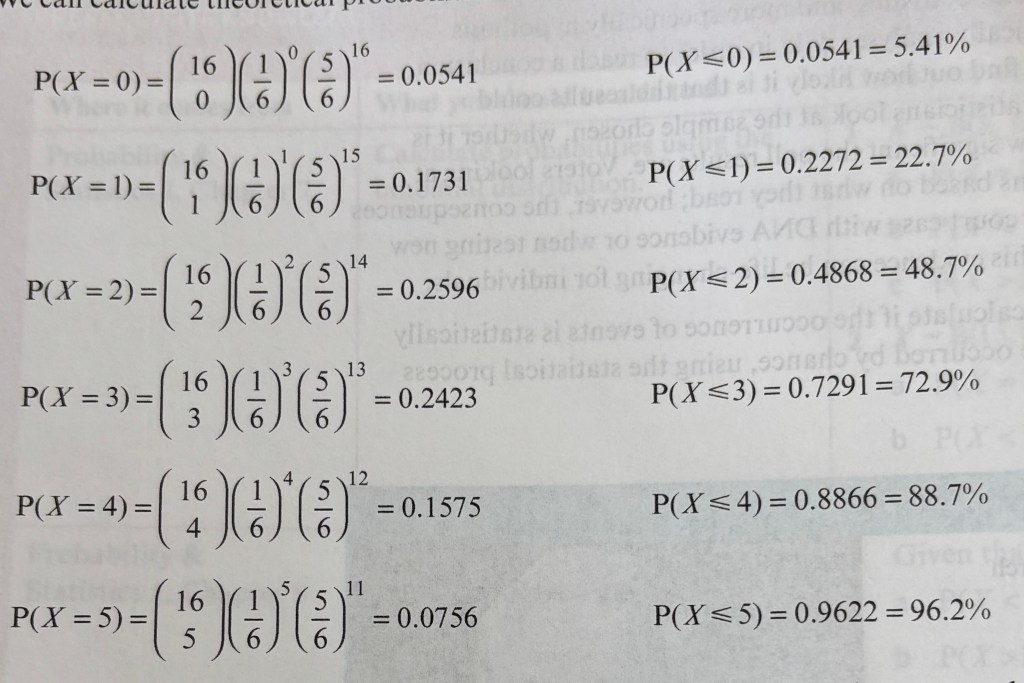
Looking at the cumulative probabilities, we can see that we would only expect to roll more than five 3s around 4% of the time (we call this percentage, 4%, the test statistic).
In hypothesis testing we decide a critical value, which is sometimes 5%, where we consider numbers beyond this critical value to be significant (we also call 5% in this case the significance level). Any values beyond this value are considered to be in the critical region (whereas numbers before this value are considered in the acceptance region). The idea is that if something happens which we would expect to happen less than 5% of the time, it is unlikely (though of course possible) that it is just down to chance. In some situations (e.g. medical) we use a stricter significance level such as 1%.
In science we never say that we have proven a hypothesis, just that the probability of it occurring by chance is very small and so we have sufficient evidence to reject the hypothesis.
In general, we call the thing we expect to be true the null hypothesis or H0 (e.g. H0: P(3) = 1/6). We call the thing that we are testing to see if it is true the alternative hypothesis or H1. (e.g. H1: P(3) < 1/6). We never accept the null hypothesis, we either say that we don’t have sufficient evidence to reject it, or we do have sufficient evidence to reject it.
Worked Example 1
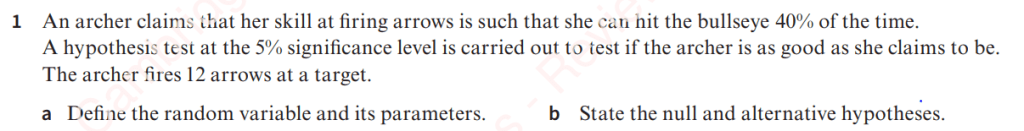
Historical records indicate that drivers using a F1 racetrack simulator crash 40% of the time.
Johnny has created a training programme and he wants to test to find out whether his training programme significantly improves drivers’ performance.
He asks 20 people who have completed his training programme to use the simulator and 4 of them crash.
Test at the 5% significance level whether his training programme is effective or not.
Worked Example 2
Studies indicate that around 10% of the world’s population is left-handed.
Suzie thinks that being left-handed may be less common amongst basketball players. She wants to test this by asking a random sample of 50 basketball players if they are left-handed.
1.) Find the rejection region at the 5% significance level and state the critical value.
2.) If the critical value is 2, what would be the least integer percentage significance level for you to conclude that Suzie is correct?
Worked Example 3
A fair pentagonal spinner can land on red, blue, black, orange or green colours. It is spun ten times and lands on red five times. Test at the 4% level of significance if the spinner is biased towards red.
N.B. As we learned in S1, a binomial distribution can be approximated using a normal distribution.
Worked Example 4
In an election, 52% vote Margaret in as club president.
One year after the election, Victoria thinks that Margaret is not as popular as she was at the time of the election. She asks 200 club members and 91 of them said they would still vote for Margaret.
Using a suitable approximating distribution, test this claim at the 5% significance level.
Worked Example 5
A specific skin cream has positive effects on 60% of people using it.
A new variant of the cream is developed and the manufacturers claim that more of the population will react positively to the new variant.
A random sample of 120 people is tested and 79 are found to react positively.
1.) Does this provide evidence at the 5% significance level of an increase in the percentage of the population that react positively to this new treatment?
2.) Find the critical value.
Exercise 1
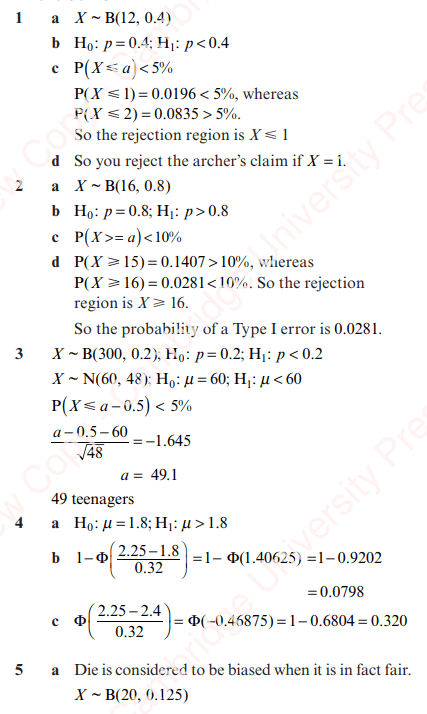
Exercise 1 Answers
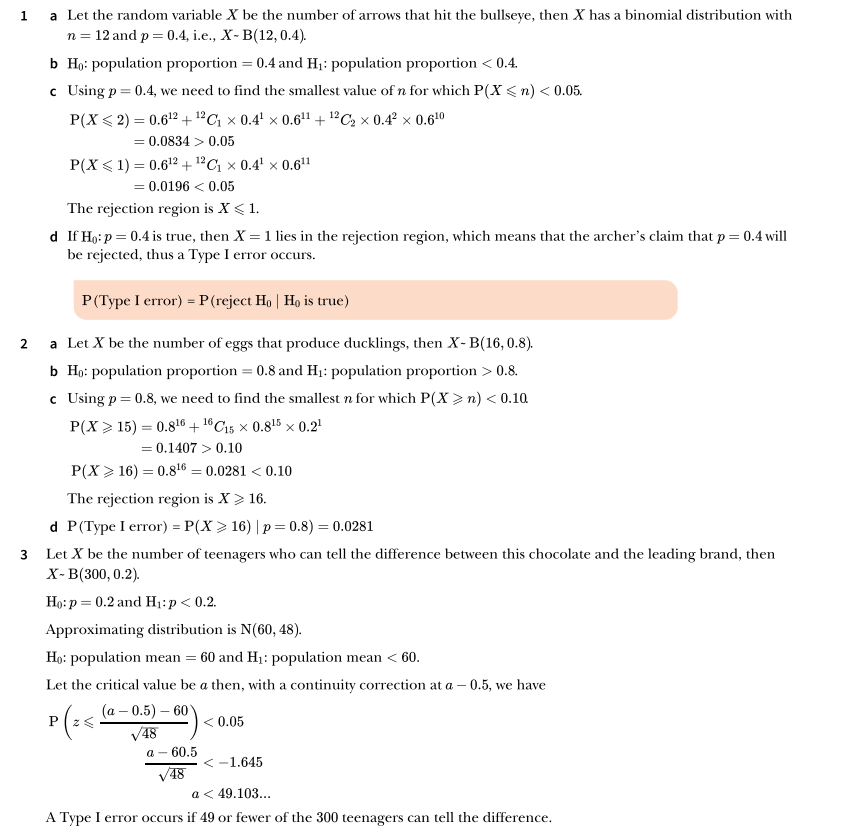
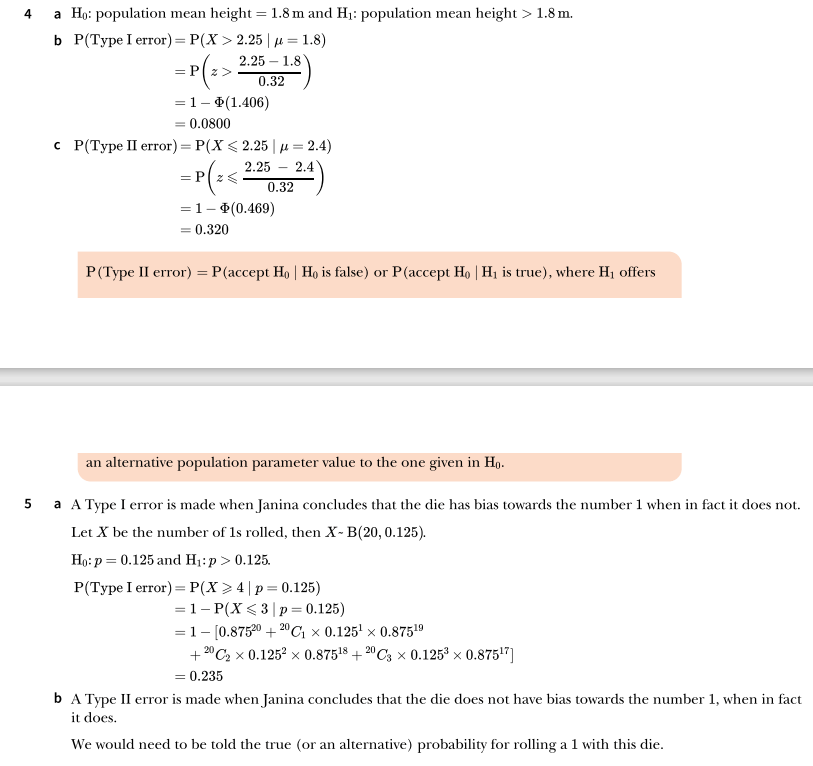
Exercise 1. Worked Solutions
One-tailed and Two-tailed Hypothesis Tests
So far all of our tests have been testing “in a direction”, e.g. the skin cream has more positive reactions, Margaret is less popular.
We call these one-tailed tests as the critical region is at one tail of the graph.
A two-tailed test would be simply testing that a dice is not fair, rather than testing it is not fair in a specific direction, i.e. testing that P(1) is not equal to 1/6. Let’s look at some worked examples of two-tailed tests:
Worked Example 6
On the Jurassic coast, 35% of the rocks contain fossils.
Alisha selects 12 rocks at random and breaks them open. She finds fossils in 2 of them.
1.) Test at the 10% level of significance if there is evidence to show that the average of 35% is incorrect.
2.) In how many of the 12 rocks would Alisha need to find fossils to reject the null hypothesis?
3.) Would Alisha’s conclusion be different if the test was one-tailed?
Exercise 2
Exercise 2. Answers


Exercise 2. Worked Solutions

Type I and Type II Errors
A parameter is based on the complete set of data from a population, whereas a sample statistic is calculated from a subset of the population.
When making inferences, we use the sample statistic to represent the population parameter and make conclusions based on a sample of observations.
Our inference can be incorrect in two different ways.
Type I error: We reject the null hypothesis when it is actually true
Type II error: We don’t reject the null hypothesis, even though the null hypothesis was actually false.
A type I error is “worse” – it is like a criminal court jury finding a defendant guilty when they were actually innocent (whereas a type II error is like them judging a defendant as not guilty, when they were indeed guilty).
- Here are some reasons we can make an error when making inferences:
- The sample data is biased;
- The probability model is not the correct model to use;
- The significance level is not appropriate for the situation.
Worked Example 7
JoJo is suspicious about a coin she has and thinks that it is biased towards “Heads”.
She tosses the coin 16 times and carries out a hypothesis test at a 5% significance level.
1.) Find the probability of a Type I error and state what is meant by a type I error in this context.
2.) Explain why a Type II error is possible if she gets 11 “Tails”.
Worked Example 8
A blood test is conducted to find out the level of a certain protein in a patient’s blood, to test if they have a specific condition. The level of protein is denoted by X.
For people with the condition, X is abnormally high.
Records kept over a long period of time indicate that for people without the condition X ~ N(10,32), whereas for people with the condition X ~ N(22,72).
1.) A doctor decided that all patients with X>17 will be classified as having the condition.
Using the null hypothesis “A person tested doesn’t have the condition”, state the alternative hypothesis and the critical region and find the probability of (a) a Type I error; and (b) a Type II error.
2.) Find the range of values of X that ensure that the probability that the test does not identify a person despite them having the condition is less than 0.03.
3.) Find the value of X where the probability of a Type I error is equal to the probability of a Type II error.
Exercise 3

Exercise 3 – Answers

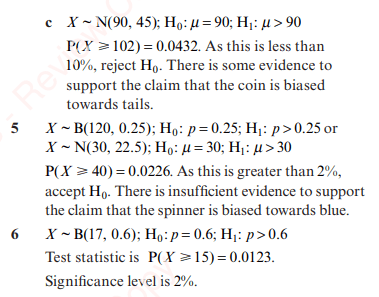
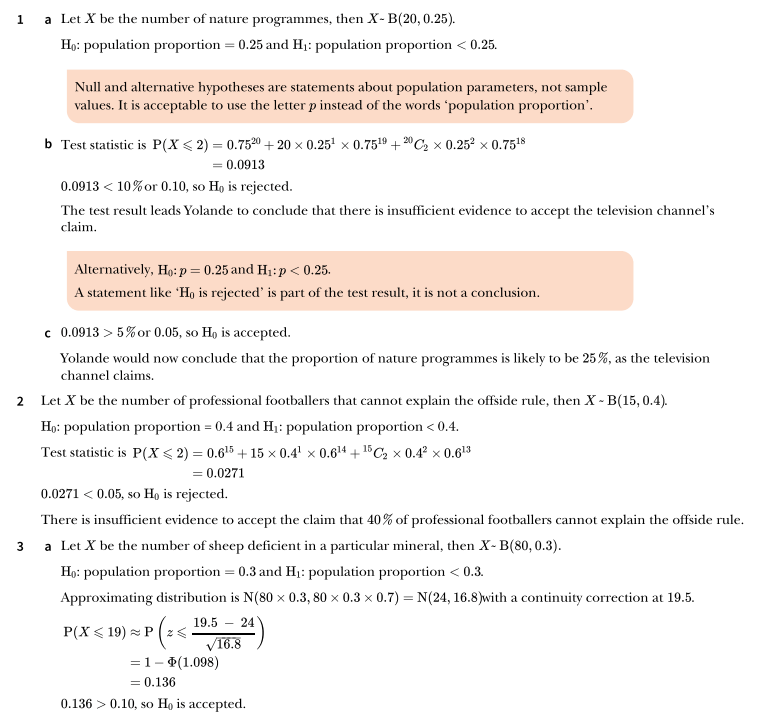
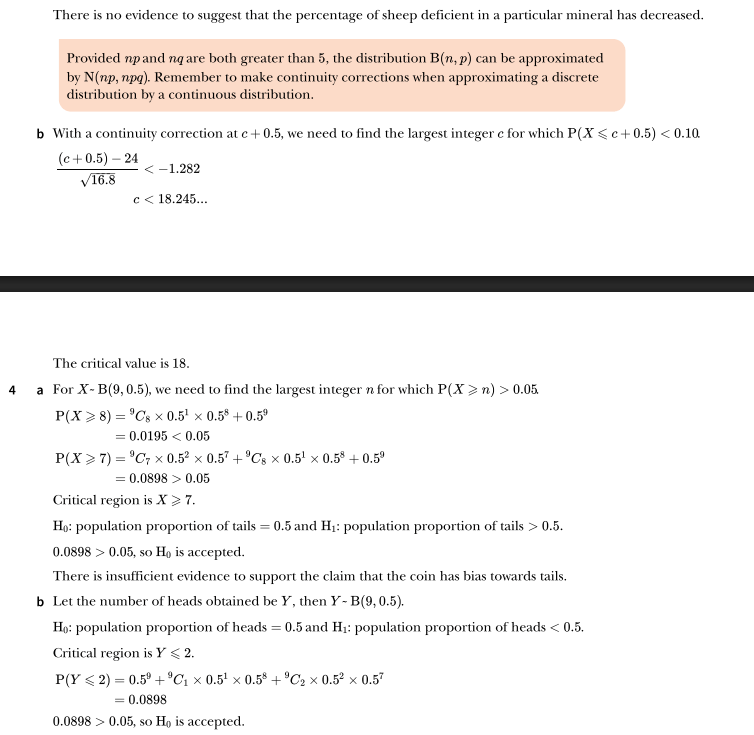
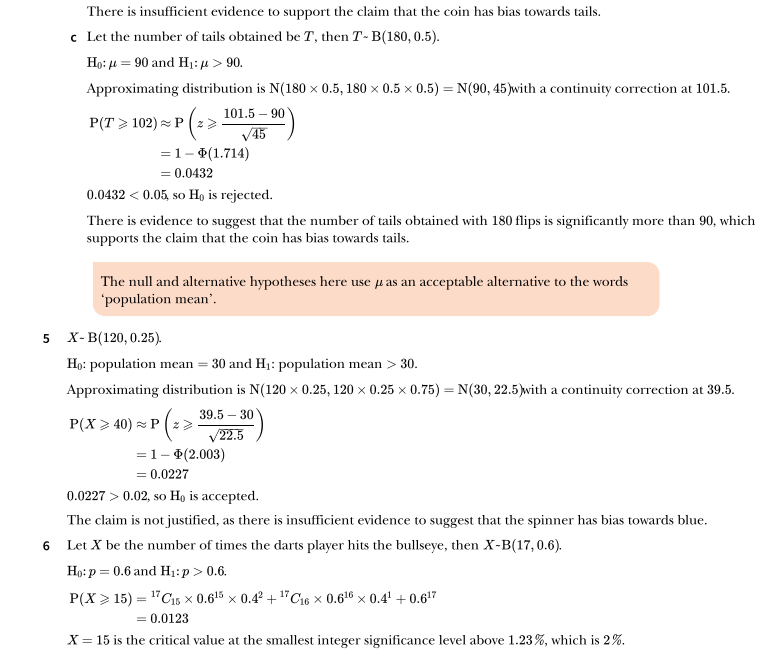
Exercise 3 – Worked Solutions
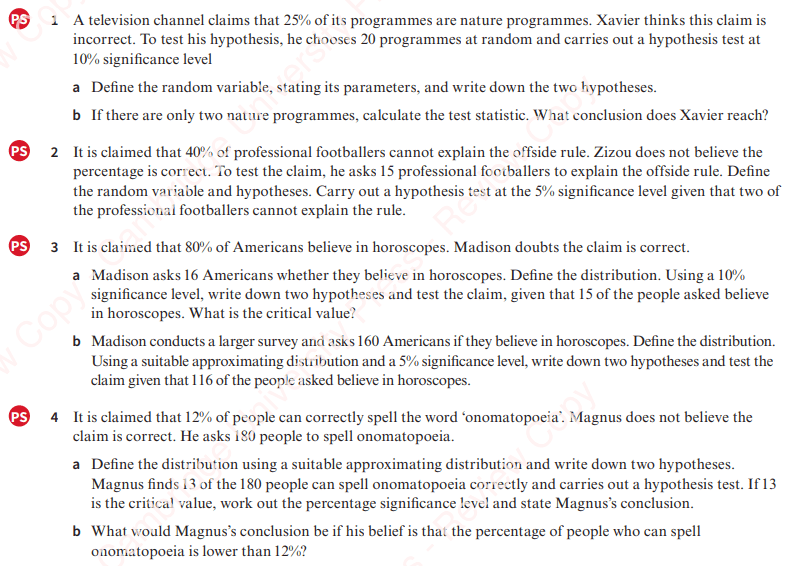
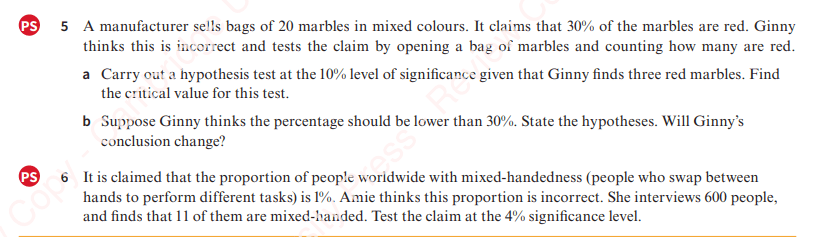
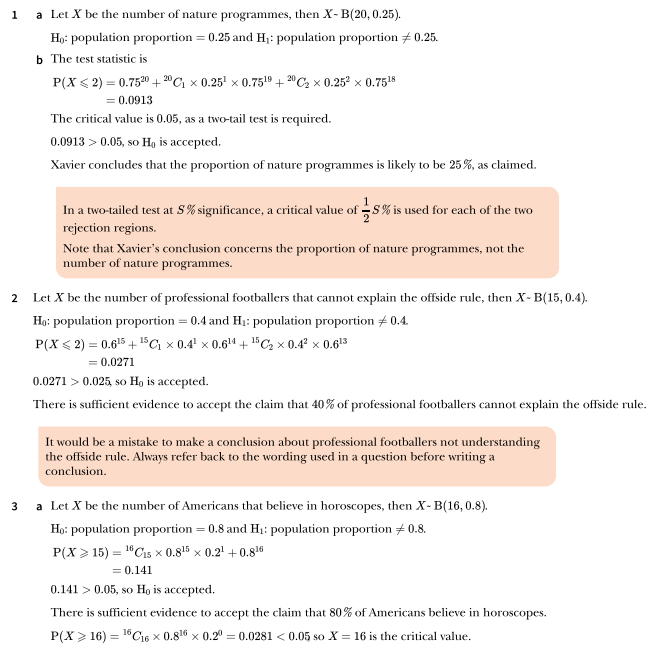
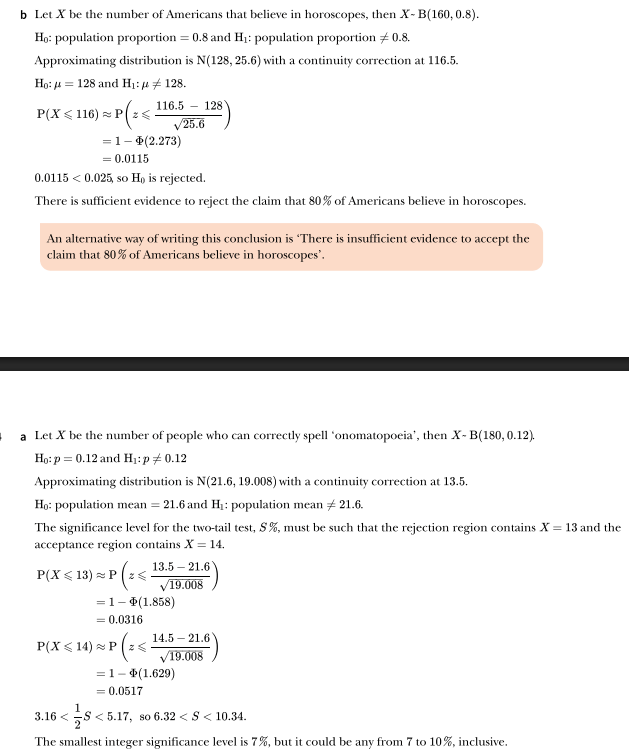
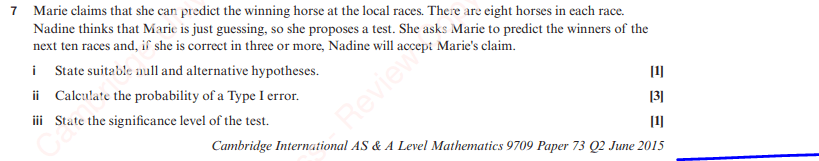
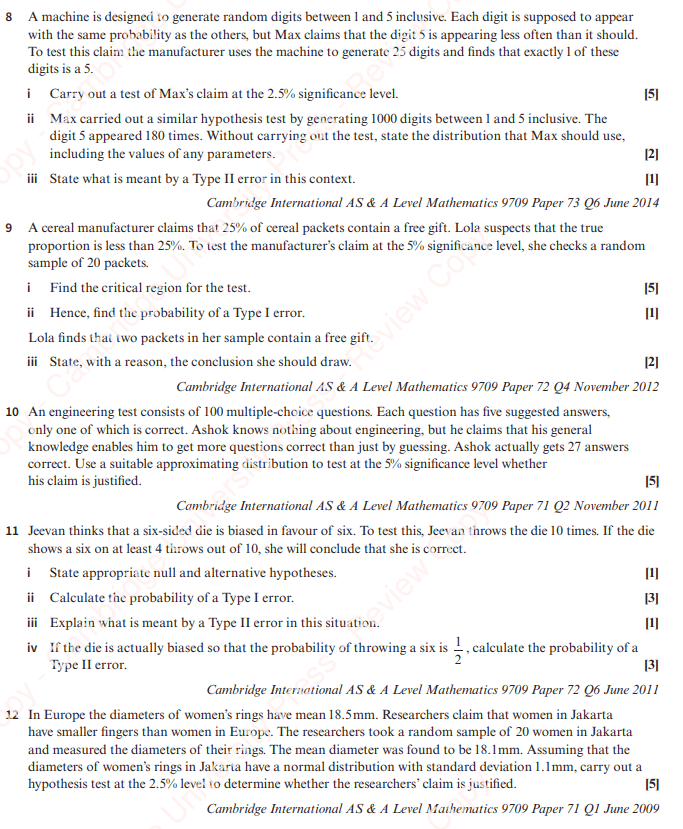
Miscellaneous Questions

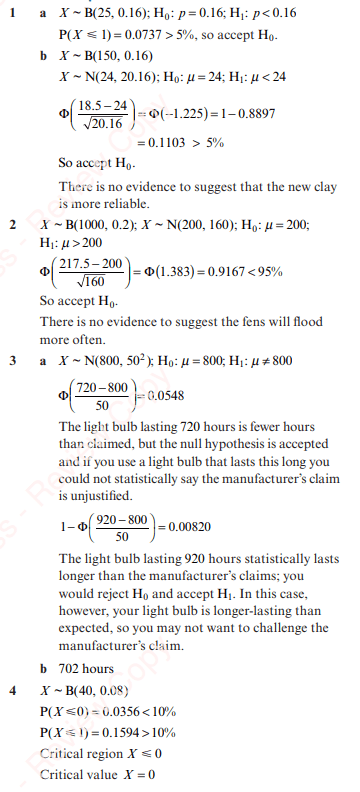
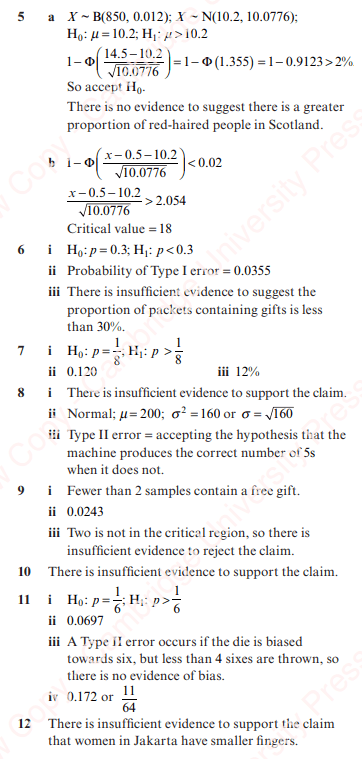
Miscellaneous Questions – Answers
Miscellaneous Questions – Worked Solutions