We use statistics like 


Unbiased estimates
The bias of an estimate is the difference between the expected value of the estimate and the true value of the parameter. This difference is the sampling error.
If 

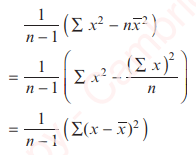
An unbiased estimate of the population variance 

As is often the case, we have various equivalent formulae that we can use to suit the way the data is presented to us:
Worked Example 1
A biologist wants to study the variance of the numbers of eggs laid by larks. The following data summarises his results for a sample of 30 larks’ nests (m).

Use the data to find an unbiased estimate for the variance of the number of eggs laid by larks.
Worked Example 2
A team of biologists measure the number of tiger cubs in a sample of 24 litters. The table below shows their findings:
| Number of cubs, c | 1 | 2 | 3 | 4 | >4 |
| Frequency, f | 2 | 7 | 12 | 3 | 0 |
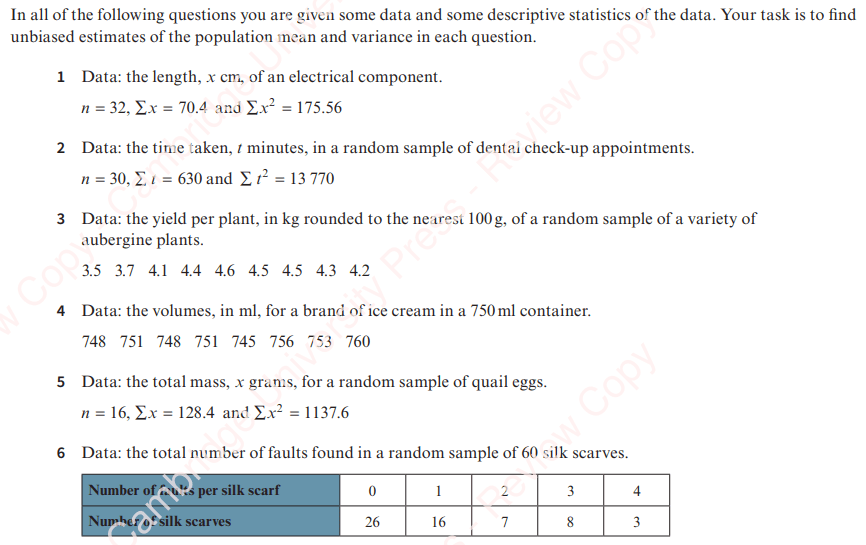
Exercise 1

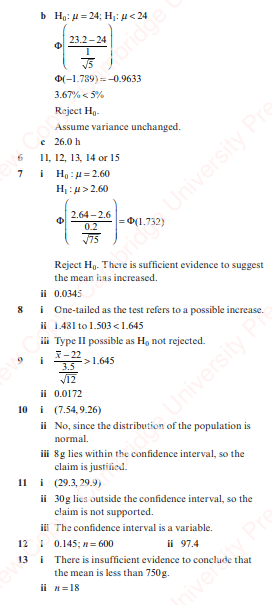
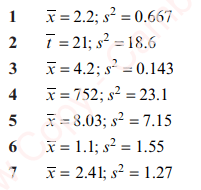
Exercise 1 – Answers
Hypothesis Testing of Population Mean
For sample data, the square root of the sample variance, that is 
If the population mean is unknown, but the population variance is known, sample data can be used to carry out a hypothesis test that the population mean has a particular value, as follows:
For a sample size n drawn from a normal distribution with known variance,

Worked Example 3
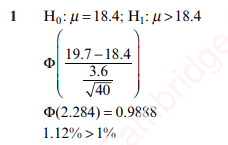
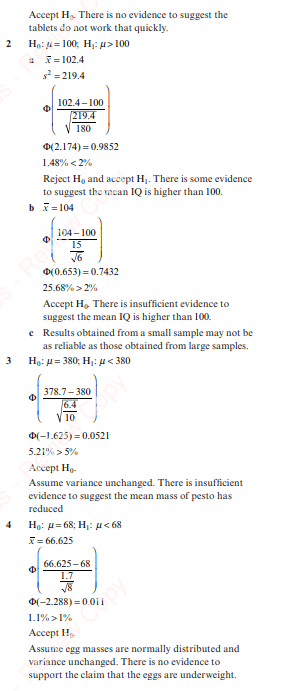
The masses of cucumbers grown on a farm are normally distributed with mean 310g and standard deviation 22g. Producers of a new plant food claim that its use increases the mass of cucumbers. To test this claim, some cucumber plants are grown using the new plant food and a random sample of 40 cucumbers from these plants are selected and weighed. The mean mass of these cucumbers is 316g.
Assuming the standard deviation of the masses of the sample is the same as the standard deviation of the population, test the claim at a 5% level of significance.
Worked Example 4
The burn time, in minutes, for a certain brand of candle is modelled by a normal distribution with standard deviation 5.7. The manufacturer claims that the mean is 250 minutes. Suzy randomly selects 10 of these candles and finds that their burn times in minutes are as follows: 245 247 236 255 250 239 241 252 251 243.
Stating any assumptions made, investigate at the 5% level of significance whether the manufacturer’s claim is valid.
Hypothesis test of population mean using a Large Sample
If the population mean and population variance are unknown, sample data can be used to conduct a hypothesis test that the population mean has a particular value, as follows:
For a large sample size n drawn with unknown variance and sample mean 

Worked Example 5
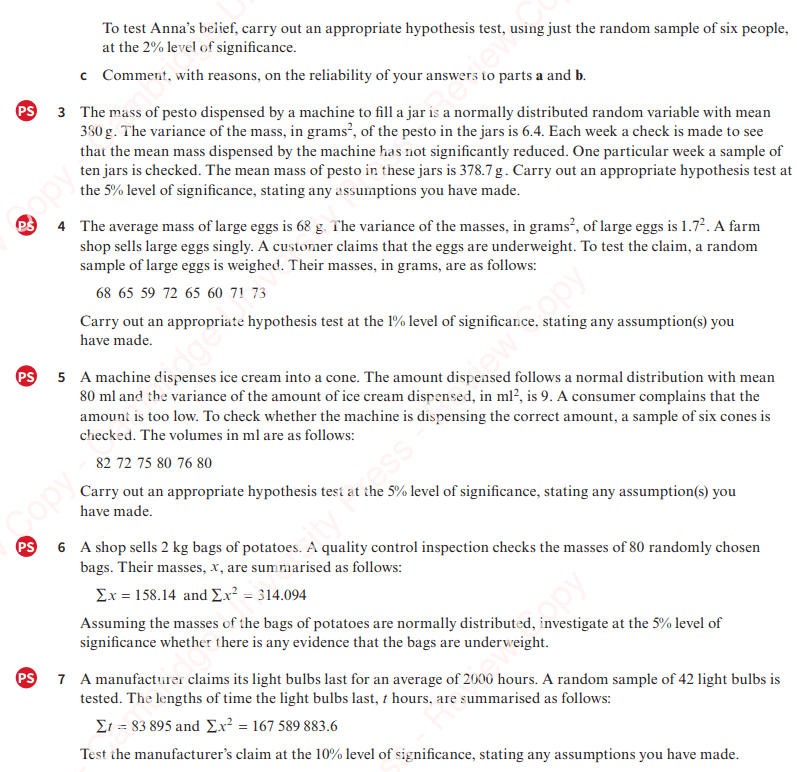
A teacher believes that students underestimate how long 1 minute is. To test his belief, 42 students are chosen at random. Each student, in turn, closes their eyes and estimates 1 minute. The results for their times, x seconds, are summarised as follows: 

Investigate at the 10% level of significance if there is any evidence to support the researcher’s claim. What advice would you give to the researcher?
Exercise 2

Exercise 2 – Answers
Confidence Intervals for Population Mean
When we do a hypothesis test using a sample, the results only apply to the sample, but we often want to apply them to the population.
To include the information that the sample may not be representative of the whole population, we can construct a Confidence Interval (CI) within which the parameter will lie.
A confidence interval for a parameter is calculated at a P% level of confidence, meaning that if the same population is sampled many times and each time an interval estimate is found, then the true population parameter will occur in P% of those intervals.
We will only consider symmetrical two sided intervals (although it is possible to construct one sided intervals).
For a Normal distribution 
So to find a 95% confidence interval, use the sample values and work out the interval

Confidence Intervals for Population Mean from Normal Population with Known Variance
A confidence interval for an unknown population parameter, such as the mean, at a P% confidence level, is an interval constructed so that there is a probability of P% that the interval includes the parameter.
To find the confidence interval for a population mean with known variance 
| %CI | 90 | 95 | 98 | 99 |
| k | 1.645 | 1.960 | 2.326 | 2.576 |
The greater the percentage, the more confident we can be that the true parameter lies in the interval.
The greater the percentage, the wider the confidence interval and the less precise we can be about the value of the true parameter.
When choosing the sample size, n, as n increases the standard error 
Worked Example 6
Excessive plant life in a pond is causing the appearance of unwanted organisms. Over a long period of time it has been found that the number of unwanted organisms in 100ml of pond water is approximately normally distributed with standard deviation 12. Eve takes six random 100ml samples of water from her pond. The numbers of unwanted organisms in the samples are 56, 102, 48, 74, 88 and 67.
- Find a 95% confidence interval for the mean number of organisms in 100ml of the pond water;
- If the mean number of unwanted organisms in 100ml of pond water is above 80, plant life should be removed. Use your results to decide whether Eve needs to remove plant life from her pond. What advice would you give to Eve?
Worked Example 7
The label on a sweet packet states that the contents’ mass is 100g. It is known that the standard deviation is 5g. The mechanism producing these packets of sweets is checked. From a random sample of ten packets, the mean is 103.8g. Find a 99% confidence interval for the mean contents of the packets of sweets. Use your result to explain whether the mechanism needs adjustment.
Confidence Intervals for Population Mean using a Large Sample
To find the confidence interval for a population mean using a large sample, calculate 

Worked Example 8
A sample of 60 strawberries is weighed, in grams. The results are summarised as follows: 

- Find a 90% confidence interval for the mean mass of the strawberrries.
- An
% confidence interval for the population mean, based on this sample, is found to have a width of 3.65g. Find
Exercise 3
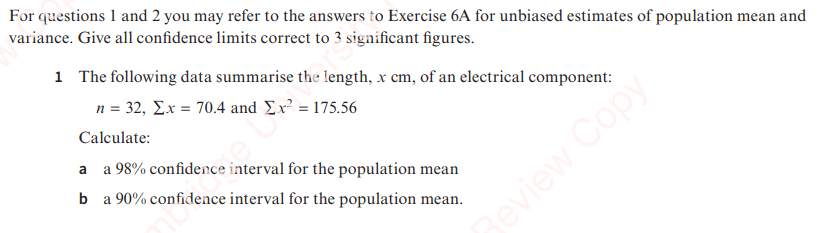
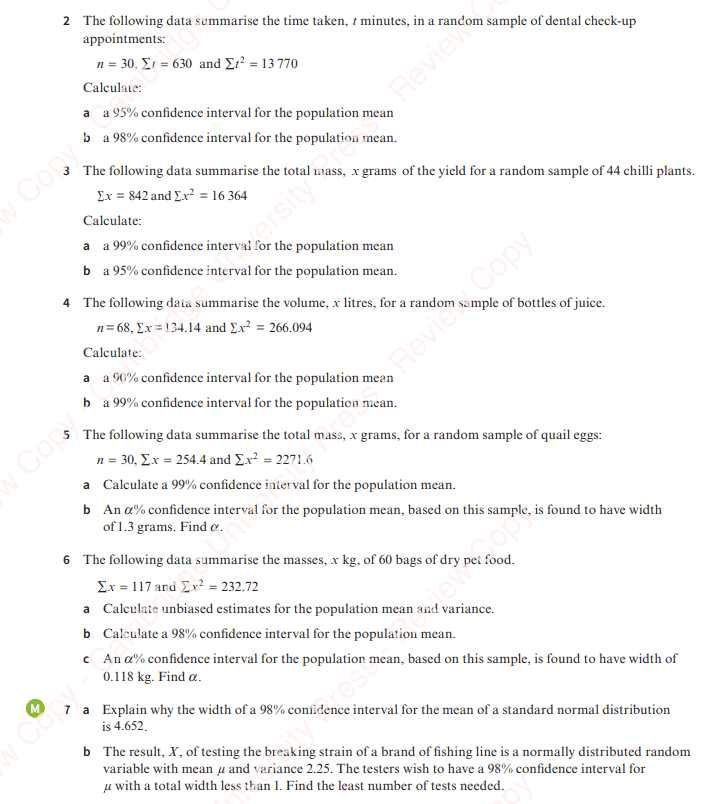
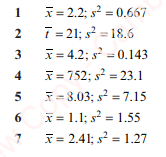
(where it says “Exercise 6A”, it means “Exercise 1” above)
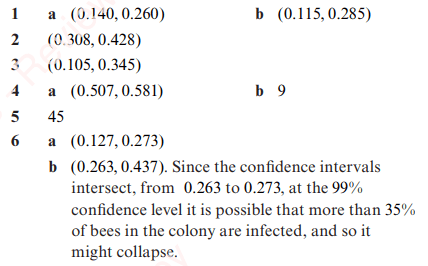
Exercise 3 – Answers
Confidence Intervals for Population Proportion
Statistical investigations aren’t always interested in parameters such as mean and variance.
Opinion polls, for instance, are often interested into which of two categories people fall in (e.g. Democrat voters or Republican voters).
In an opinion poll of n people, where r people say the will vote Republican, the proportion of success for the Repulicans is 
As there are a fixed number of people, each independently choosing one of two options, the binomial model is appropriate.
If we let the random variable X be the number of people who vote Republican, then X ~ B(n,p), E(X) = np and Var(X) = np(1-p)
Let 

So 


So, let’s suppose 200 people are asked in an opinion poll and 108 say the would vote Republican, the other 92 saying they would vote Democrat. We may think this means Republicans are going to win the election, however to consider how reliable this conclusion is we would have to find a confidence interval for the population proportion.
For sufficiently large values of n, with np>5 and n(1-p) > 5, a Binomial distribution can be approximated by a Normal distribution, namely

We can hence use the following as a confidence interval for 
Worked Example 9
A Kakuro puzzle is classified “easy” if more that 70% of people can solve it within 10 minutes, or “hard” if less than 20% of people can solve it within 10 minutes. Otherwise it is classified as “average”.
120 people were given the Kakuro puzzle and 87 managed to complete it in 10 minutes.
- Find an approximate 99% confidence interval for the proportion of people completing the puzzle within 10 minutes. Comment on how the Sudoku should be classified;
- 200 random samples of 120 people were taken and a 99% confidence interval for the proportion was found from each sample. How many of these 200 confidence intervals would be expected to include the true proportion?
Worked Example 10
Trainee teachers spend four days a week at school and one day a week at university. It is suggested that the university day be switched from Monday to Friday. The university will consider changed the day if 80% of trainee teachers are in favour of the change. In a sample of trainee teachers, how many should be asked in order to be 90% certain of gaining 80% support that is not more than 5% wrong?
Exercise 4

Exercise 4 – Answers
Miscellaneous Exercise
Miscellaneous Exercise Answers