We will start to look at continuous random variables beyond those that are modelled by a Normal distribution.
We remember that probability density = (frequency density) / (total frequency)
A graph of a continuous variable will be a curve, and as the area below the graph represents probability, it will equal 1. We can use definite integration to find the area under the curve.
To summarise, a graph, f(x), representing a continuous random variable is the probability density function (PDF). The PDF has the following properties:
- It cannot go below the x-axis since you cannot have a negative probability;
- Total probability of all outcomes = 1, hence


In many situations, the data are defined across a specific interval or across specified intervals, outside of which f(x) = 0.
Specific individual values each have a zero probability of occurring, i.e. for a continuous random variable iwth PDF f(x), P(X=a) = 0.
Because we cannot find the probability of an exact value, when finding the probability in a given interval, it does not matter whether you use < or 

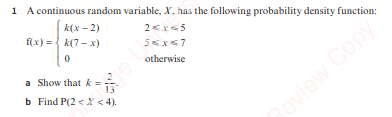
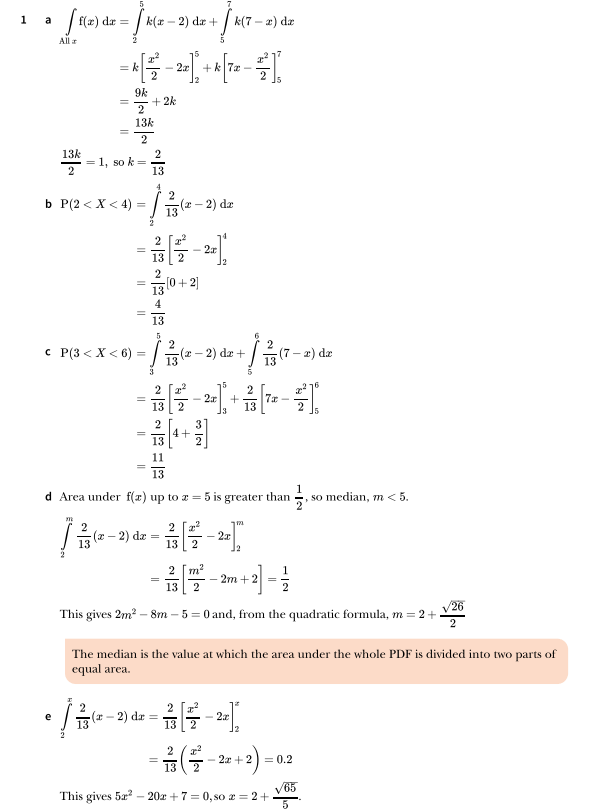
Worked Example 1
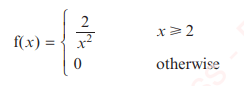
The height reached by water erupting from a broken water pipe, X metres, is modelled by the following PDF:

- Show that k = 333;
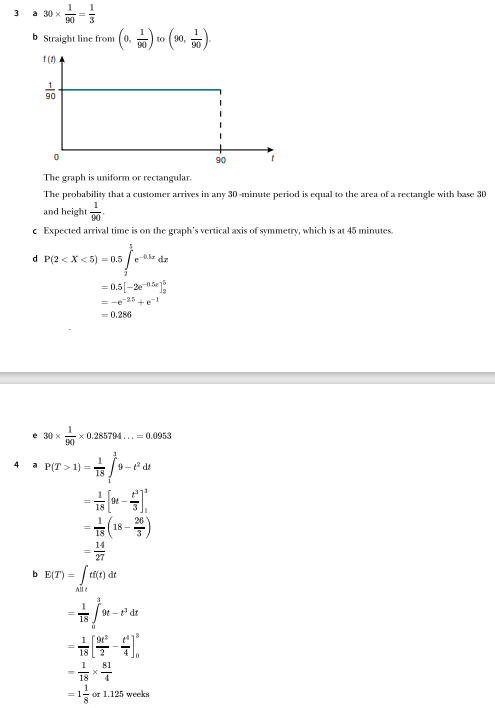
- Sketch the graph of f(x);
- Find the probability that the water reaches a height of at least 6m.
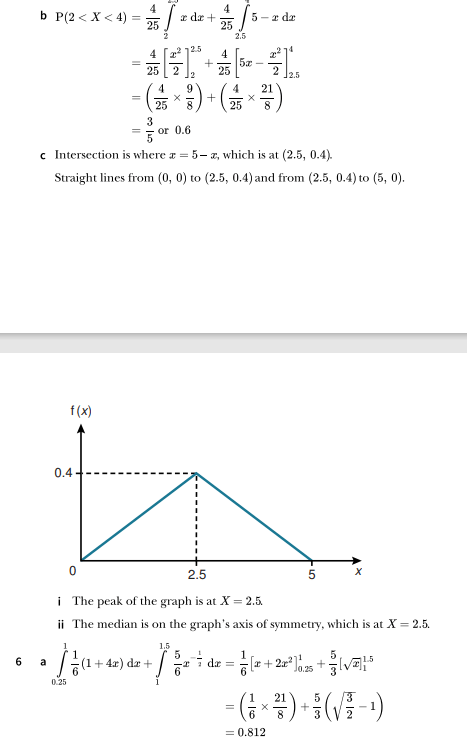
Worked Example 2
A brand of laptop battery has a lifetime of X years. It is suggested that the variable X can be modelled by the following PDF:
- Sketch the graph of f(x);
- Show that f(x) has the properties required of a probability density function;
- Find the probability that the battery lasts for more than 3 years;
- Work out the value m such that P(X<m) = 1/2
Exercise 1
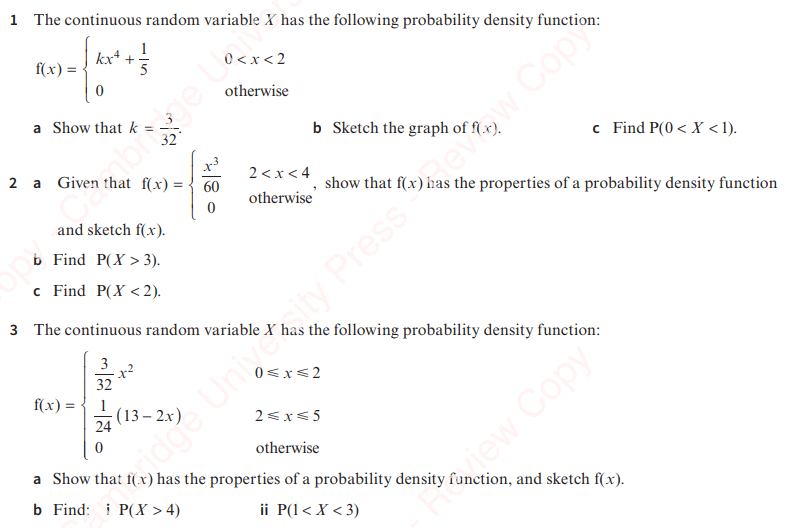

Exercise 1 – Answers

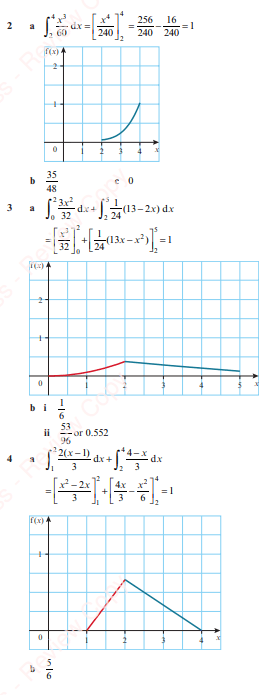

Exercise 1 – Worked Solutions


Finding median and other percentiles of a continuous random variable
The median is the value m such that P(X<m) = 1/2 (or, equivalently, P(X>m) = 1/2). This can be calculated using: 
Worked Example 3
For any given time I arrive at a bus stop, the arrival time of a bus can be modelled by the continuous random variable X, whose PDF, f(x), is given by:

Find the median and the interquartile range of the arrival time of the bus.
Worked Example 4
A continuous random variable, X, has PDF f(x) given by:

- Show that the median value, m, is given by 2m2 – 24m + 43 = 0
- Find the value of m, correct to 2 decimal places.
Worked Example 5
A continuous random variable, X, has PDF f(x) given by:
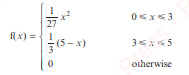
- Find the median.
- Find the lower quartile.
Exercise 2


Exercise 2 – Answers


Exercise 2. Worked Solutions


Expectation and Variance
The formula for the mean of x, E(X) = 

Similarly with variance, 
![Var(X) = E(X^2) - {E(X)}^2 = \int_{ - \infty }^{ \infty } x^2 f(x) dx - [\int_{ - \infty }^{ \infty } x^2 f(x) dx]^2](https://s0.wp.com/latex.php?latex=Var%28X%29+%3D+E%28X%5E2%29+-+%7BE%28X%29%7D%5E2+%3D+%5Cint_%7B+-+%5Cinfty+%7D%5E%7B+%5Cinfty+%7D+x%5E2+f%28x%29+dx+-+%5B%5Cint_%7B+-+%5Cinfty+%7D%5E%7B+%5Cinfty+%7D+x%5E2+f%28x%29+dx%5D%5E2+&bg=ffffff&fg=000&s=0&c=20201002)
Worked Example 6
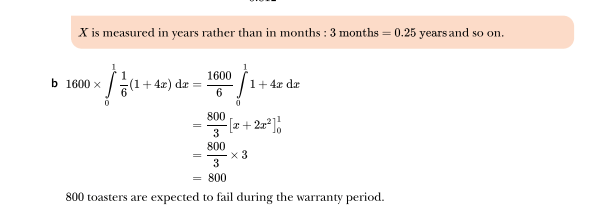
The time, in minutes, taken by students to answer a question in a multiple-choice test has a PDF f(t) as follows:
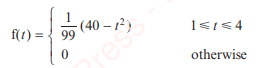
Work out the mean and variance of the time taken.
Worked Example 7
The arrival time, x, of a taxi is a continuous random variable X, whose PDF f(x) is given by:
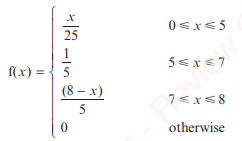
The taxi firm states that, on average, a taxi will arrive within 5 minutes. Is this statement true or false?
Exercise 3


Exercise 3 – Answers

Exercise 3 – Worked Solutions


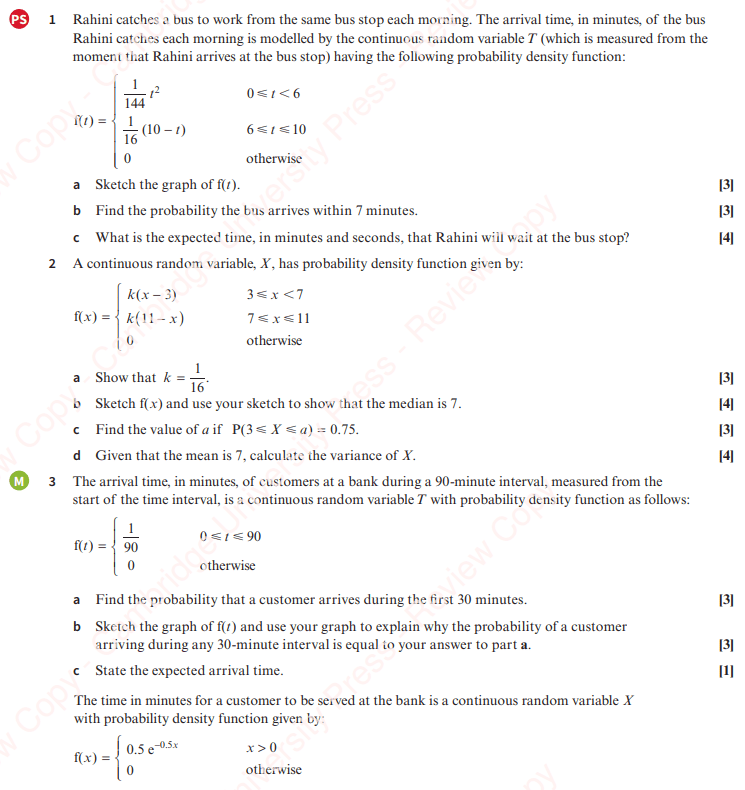
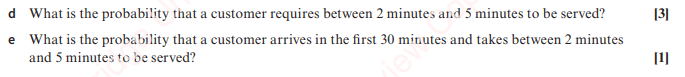
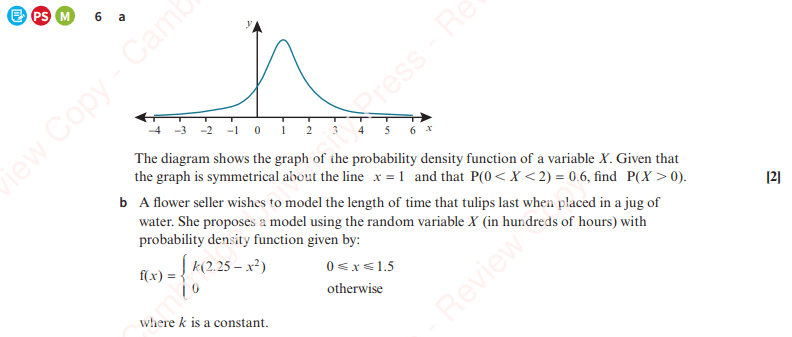
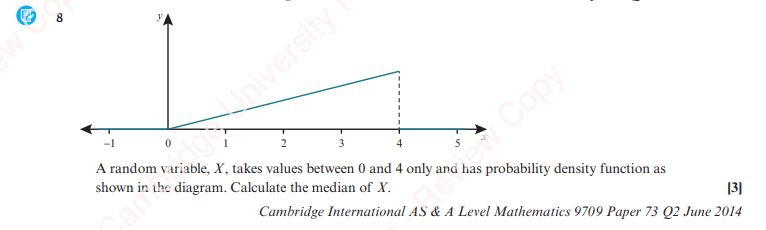
Miscellaneous Exercise


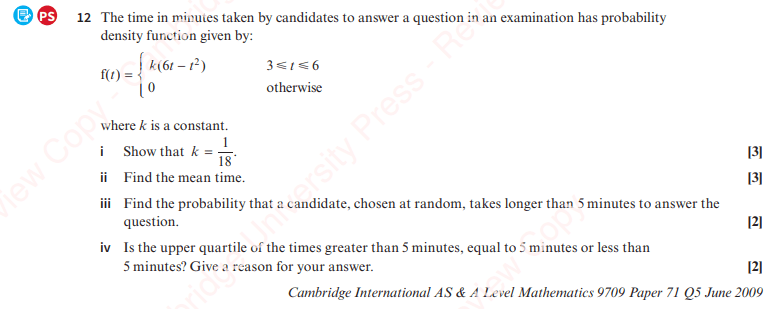
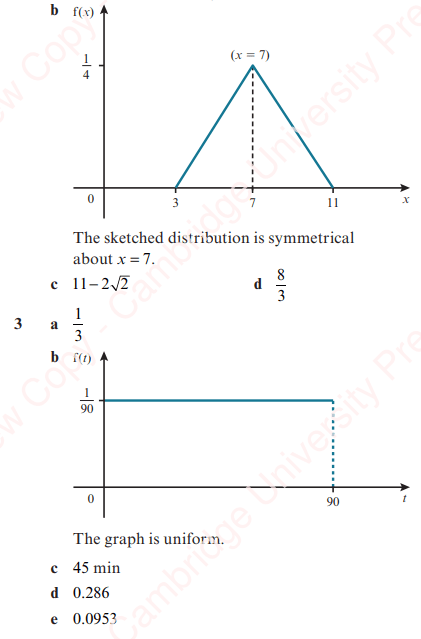
Miscellaneous Exercise – Answers


Miscellaneous Exercise – Worked Solutions