Kinematics is the study of motion.
Sometimes we will look at scalar quantities like distance and speed, and sometimes at vector quantities like displacement and velocity.
What is the difference between a scalar quantity and a vector quantity?
Speed and Distance
s = d ÷ t, where s = speed, d=distance covered and t = time taken. This applies for constant speed, or gives us the average speed if speed is not constant.
Similarly, average velocity = change in displacement ÷ time taken, which we can rearrange to write as s = v x t (s = displacement, v = velocity, t = time)
Clearly units should always be consistent. We will typically use SI units (distances in metres and time in seconds)
Models and Assumptions
When we make any assumptions (e.g that speed is constant), we should always consider whether the assumption is reasonable in the context of the question (and what the impact of changing the assumption would be).
Throughout this course we will be treating objects as particles that are not affected by things such as rotation or deformation.
Worked Examples
1.) A car travelling at constant speed travels 9km in 15 minutes. Find its speed in ms-1.
2.) A cyclist travels at 5ms-1 for 30s and then turns back and travels at 3ms-1 for 10s. Find her displacement in the original direction of motion from her starting position.
Exercise 1
1.) A cyclist covers 120m in 15s at constant speed. Find her speed.
2.) A sprinter runs at a constant speed of 
3a.) A cheetah spots a grazing gazelle 150m away and runs at a constant speed of 
3b.) What assumptions have been made to answer this questions?
4.) The speed of light is 
5.) The land speed record was set in 1997 as 
6a.) A runner runs at 

6b.) What assumptions have been made to answer this question?
7a.) A remote control car travels forward at 

7b.) Find its average velocity in the direction in which it started driving forwards.
7c.) Find its average speed.
8.) A speed skater averages 

9.) The speed of sound in wood is 

10.) An exercise routine involves a mixture of jogging at 

11.) Two cars are racing over the same distance. They start at the same time, but one finishes 8s before the other. The faster one averaged 

12.) Two air hockey pucks are 2m apart. One is struck and moves directly towards the other at 

Exercise 1 Answers
1.)
2.) 63m
3.a) 6s
3.b) The cheetah can instantly attain their top speed. The gazelle remains stationary.
4.) 8 minutes and 20 seconds
5.) 2.94s
6a.)

6b.) The speeds are average speeds or the runner instantaneously changes speed between sections.
7a.) 45m
7b.)
7c.)
8.

9. 0.09s
10. 80s
11. 15,840m
12. 1.014m in 0.78s
Acceleration
Acceleration is a vector quantity that measures the time taken of a change in velocity: 
Positive acceleration represents an increase in velocity over time and negative acceleration reflects a decrease in velocity over time.
If acceleration is constant, then average velocity = 

Worked Examples
- A parachutist takes 5 seconds to fall from rest to 49ms-1. What is her acceleration?
- A tractor accelerates from 5ms-1 to 9ms-1 at 0.5ms-2. Find the distance covered by the tractor during this period.
- A cyclist is travelling along a straight road. He accelerates at a constant rate from a speed of 4ms-1 to a speed of 7.5ms-1 in 40s. Find:
- the distance that he travels in these 40 seconds; and
- his acceleration in these 40 seconds.
Exercise 2
1.) A car accelerates from 

2.) A car accelerates from rest to
3.) A car accelerates from 
4.) An aeroplane accelerates at a constant rate of 
5.) A speedboat accelerates at a constant rate of 

6.) A car decelerates at a constant rate of 

7.) A car accelerates from an initial velocity of 


8a.) A sprinter covered 60m in 10s accelerating from a jog. Her final velocity is 
8b.) What assumptions have been made to answer this question?
9.) A wagon is accelerating down a hill at constant acceleration. It took 1s more to accelerate from a velocity of 

10.) A driver sees a junction 100m ahead. She lets her car slow at constant deceleration of 
11.) A cyclist is travelling at a velocity of 


Exercise 2 Answers
1.)
2.)

3.) 1.5s
4.)

5.)

6.)

7.) 48m
8a.)

8b.) The sprinter can maintain a constant acceleration and we are ignoring the shape of the sprinter’s body and the different positions it takes when running, by considering the sprinter having a single position at any point in time.
9.)
10.)
11.) He can pedal because doing nothing he will arrive at the bend with velocity 
Constant Acceleration Formuale
(1.)

(2.)

(3.)
(4.)

(5.)

You should memorise these formulae. which are the most important in mechanics. The first two have been mentioned above and the remaining three you will derive in a following exercise
Worked Examples


Exercise 3
1.) For each part of question 1, assume constant acceleration, write down the equation relating the four variables in the question, and use it to find the missing variable:
1a.) Find s when 

1b.) Find s when 

1c.) Find a when s=40m, 
1d.) Find a when s=28m, 
1e.) Find a when s=24m,

1f.) Find u when s=45m, 
1g.) Find v when s=24m, 
1h.) Find s when 


2.) For each part of question 2, assume constant acceleration and find the first time t, for positive t, when the following situations occur:
2a.) Find t when 

2b.) Find t when 

2c.) Find t when 

3.) Assuming constant acceleration, find v when s=6m, 
4.) Assuming constant acceleration, find u when s = 60m, 

5a.) Assuming constant acceleration, find v when s=18m,
5b.) Why is it not necessary to specify in this question whether the object has changed direction during the motion?
6.) A car is travelling at a velocity of 

7.) An aeroplane accelerates at a constant rate along a runway from rest until taking off at a velocity of 
8.) An aeroplane accelerates from rest along a runway at a constant rate of 
9.) A motorcyclist sees that the traffic lights are red 40m ahead of her. She is travelling at a velocity of
10a.) A driver sees the traffic lights change to red 240m away when he is travelling at velocity of 
10b.) What assumptions have been made to answer the question?
11.) In a game of curling, competitors slide stones over the ice at a target 38m away. The stone is released directly towards the target with velocity 

12.) A golf ball is struck 10m from a hole and is rolling towards the hole. It has an initial velocity of 
13.) A driverless car registers the traffic lights change to amber 40m ahead. The amber light serves as a 2s warning before a red light. The car is travelling at 

14a.) You can use the first two SUVAT equations, i.e. v=u+at and 

14b.) Derive the remaining two equations, 

15.) Show that an object accelerating with acceleration a from velocity u to velocity v, where 0<u<v, over a time t is travelling at a velocity of 

16.) Show that an object accelerating with acceleration a from velocity u to velocity v, where 0<u<v, over a displacement s is travelling at a speed of 

Answers

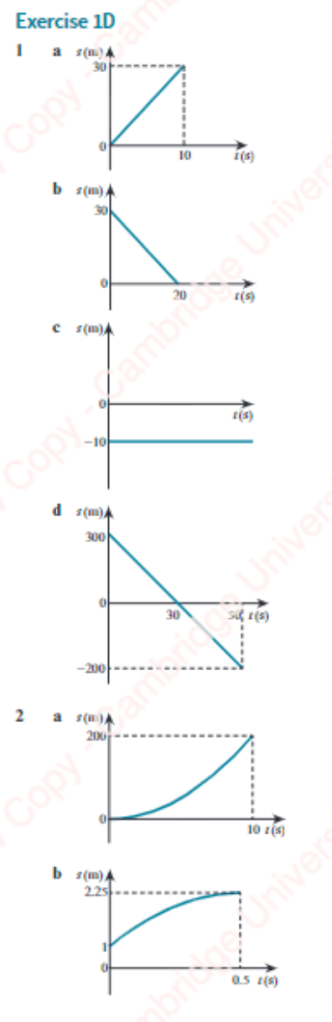
Displacement-Time Graphs and Multi-Stage Problems
On graphs, time is always plotted on the x-axis.
On a displacement-time (“s-t”) graph, a horizontal line indicates no movement. In general, the gradient of the line indicates the speed. A curve indicates that there is acceleration. The graph may go below the axis to indicate the opposite direction of motion.
Worked Examples
WE1.

WE2.
A sprinter in a 100 metre race pushes off the starting block with a speed of 

What is her time for the whole race?
Exercise


Answers


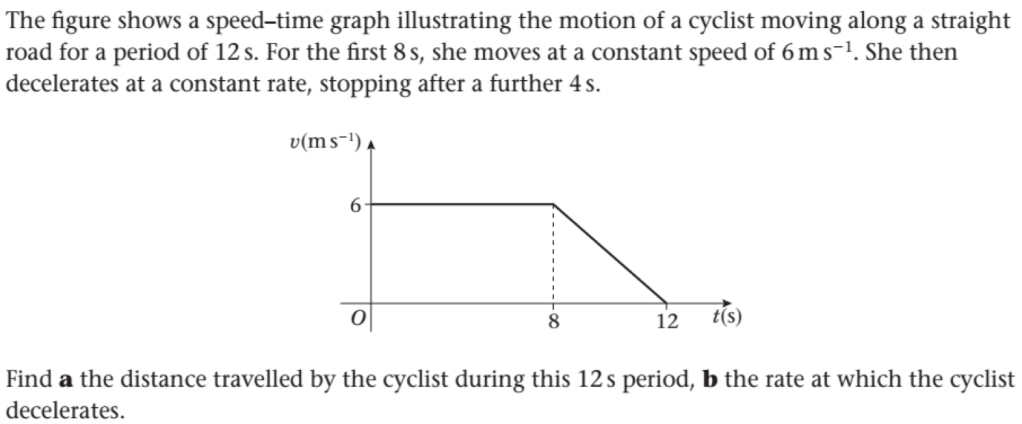
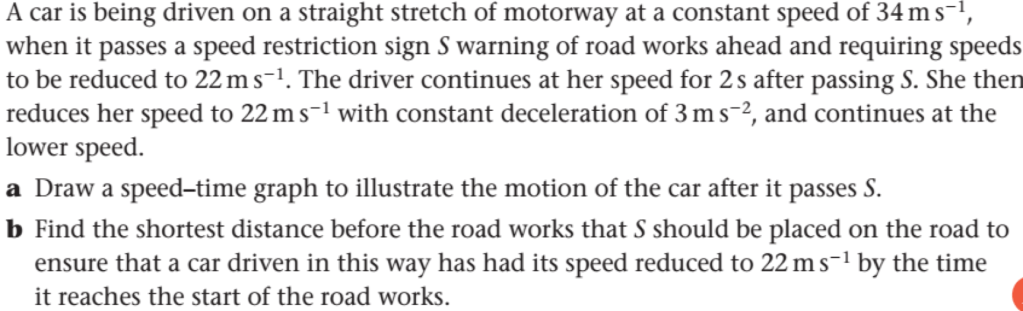
Velocity-time graphs, Speed-time graphs and Distance-time graphs

By contrast, on a velocity-time (“v-t”) graph, a horizontal line indicates constant speed. The gradient of a velocity-time graph indicates acceleration (think about the formula
Important: The area under a velocity time graph equals displacement.
Discontinuities
Sometimes velocity can appear to change instantaneously, for instance when a bat hits a ball. This will be represented on a v-t graph by a discontinuity. We can use a dotted line to mark this.
An s-t graph cannot have a discontinuity (until teleporting is invented 🤔), a bat hitting a ball would be represented by a sharp change in gradient, so the curve would not be smooth.
Worked Examples
WE1.
WE2.
A particle is moving in a straight line. The particle starts with speed 

(a.) Sketch a speed-time graph illustrating the motion of the particle;
(b.) Find the total distance moved by the particle during its 20 seconds of motion;
(c.) Sketch a distance-time graph illustrating the motion of the particle.
WE3.
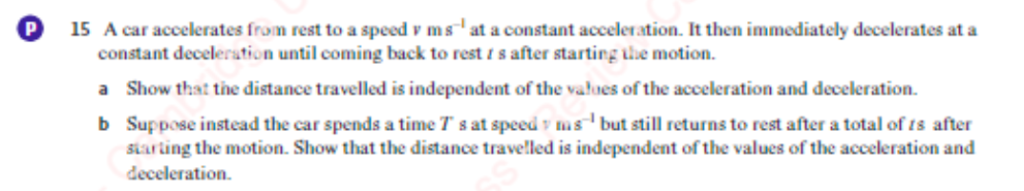
Various Exercises including Combined on Everything Above


Answers


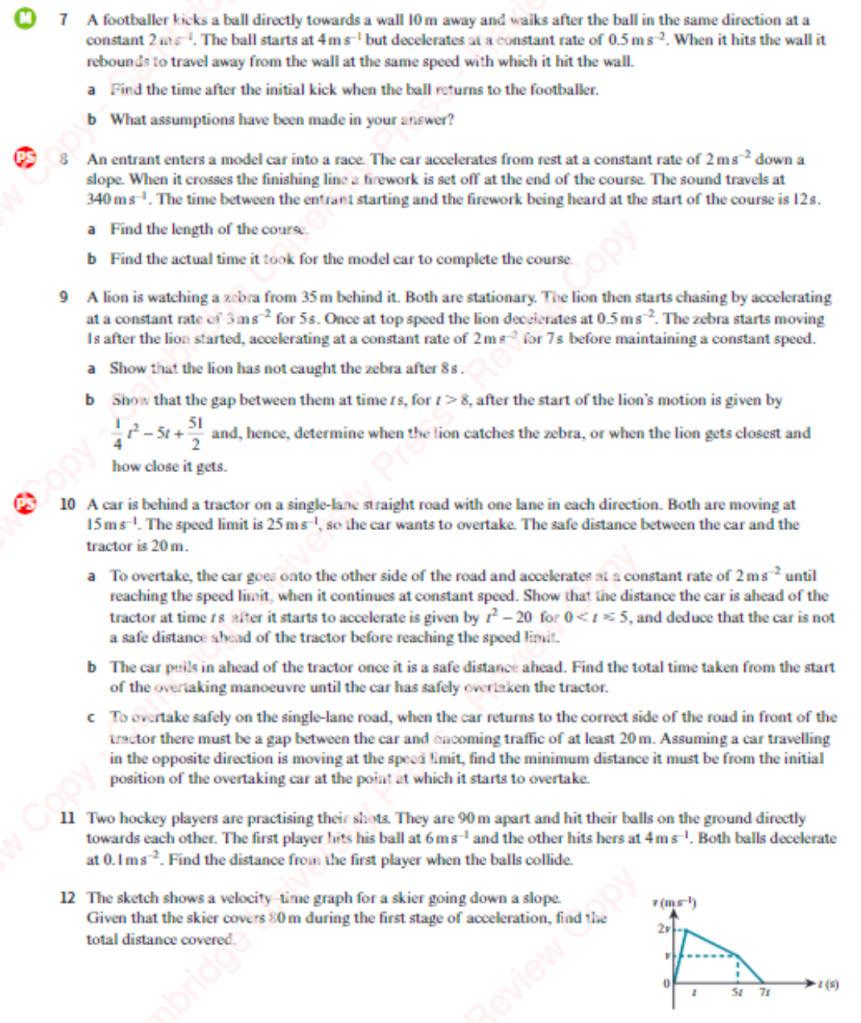
7.) 4s – Assumptions: e.g. Ball immediately starts moving at 4ms-1, acts as a particle, rebounds with same deceleration.

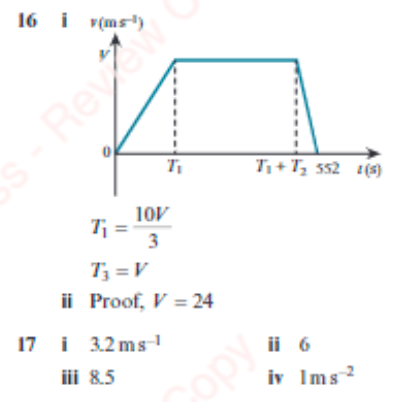
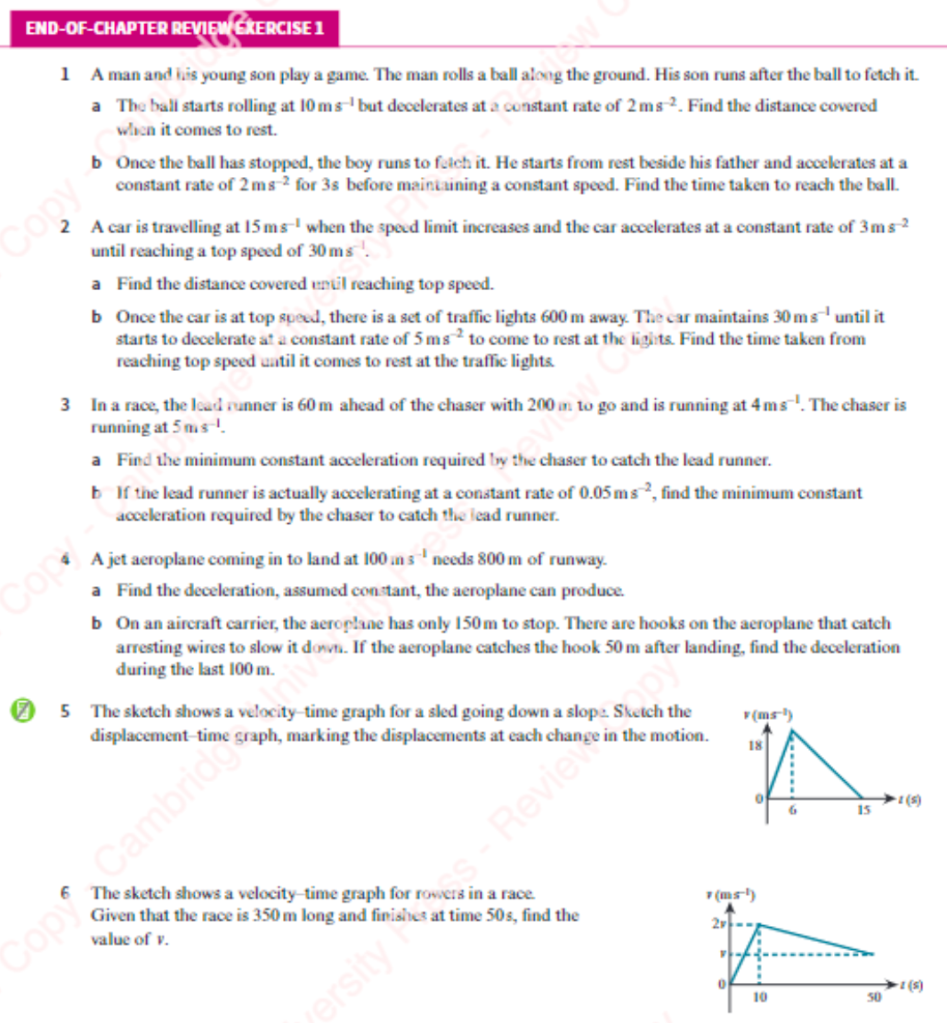
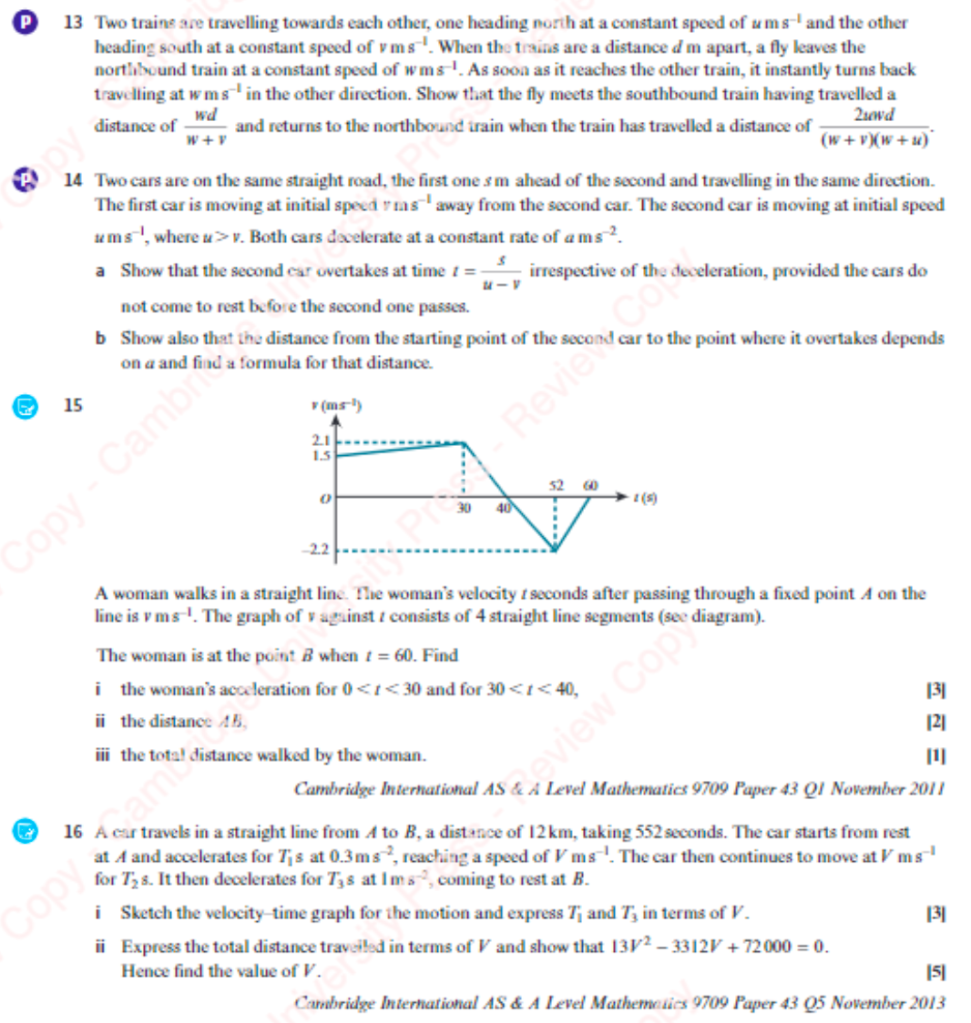
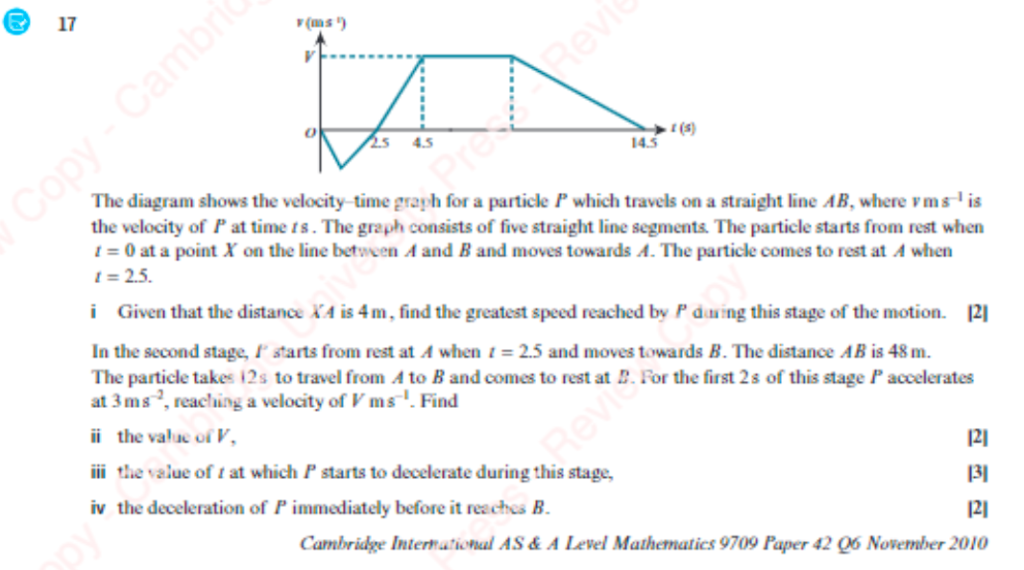
15. (i.) 0.02ms-2, -0.21ms-2, (ii) 42.5m, (iii) 86.5m