1. The table shows real GDP and unemployment for an economy.
| Economic indicators | 2019 | 2021 |
| Real GDP ( $ billions ) | 40 000 | 38 000 |
| Unemployment ( millions ) | 2 | 3 |
What can be concluded from the data?
A Demand-pull inflation is likely to increase.
B Potential output is likely to increase.
C The balance of payments deficit is likely to increase.
D The budget deficit is likely to increase.
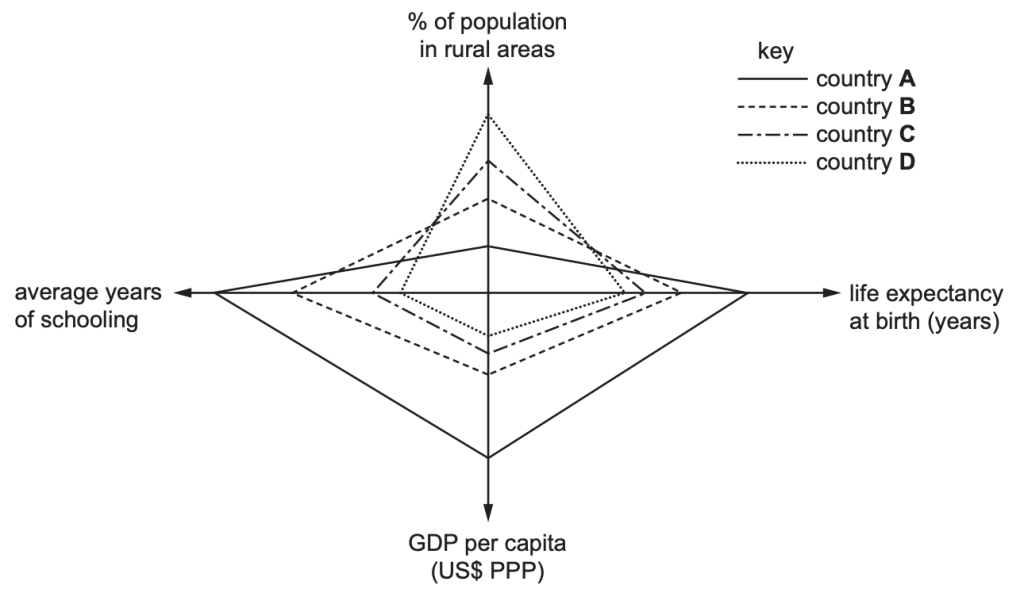
2. The diagram shows data on various aspects of four countries.
Which country is likely to be most developed?
3. What is illustrated by the Laffer curve?
A As income increases, fewer hours will be worked.
B As income increases, tax revenue will increase.
C As the tax rate increases, tax revenue always increases.
D As the tax rate increases, tax revenue will eventually fall.
4. A government decides to increase direct taxation.
Which combination would describe the impact of this policy on unemployment, growth and
balance of payments?
| Unemployment | Growth | Balance of Payments | |
| A | Improves | Improves | Improves |
| B | Improves | Improves | Worsens |
| C | Worsens | Worsens | Improves |
| D | Worsens | Worsens | Worsens |
5. How will inflation and unemployment most likely be affected by a rise in the rate of income tax if
government expenditure does not change?
| Inflation | Unemployment | |
| A | Falls | Rises |
| B | Falls | Falls |
| C | Rises | Rises |
| D | Rises | Falls |
