1. The diagram shows the long-run average cost curves (LRAC) for a firm.
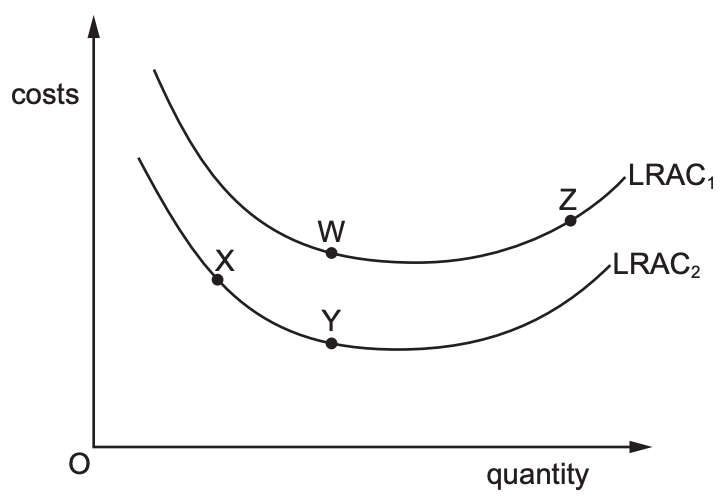
Which combination of movements correctly describes each type of economy or diseconomy of
scale?
| Internal economies of scale | Internal diseconomies of scale | External economies of scale | |
| A | W to Y | X to W | Z to W |
| B | W to Y | Y to W | Z to W |
| C | X to Y | W to Z | W to Y |
| D | X to Y | Y to X | W to Y |
2. The diagram shows the cost and revenue curves for a monopoly market structure.
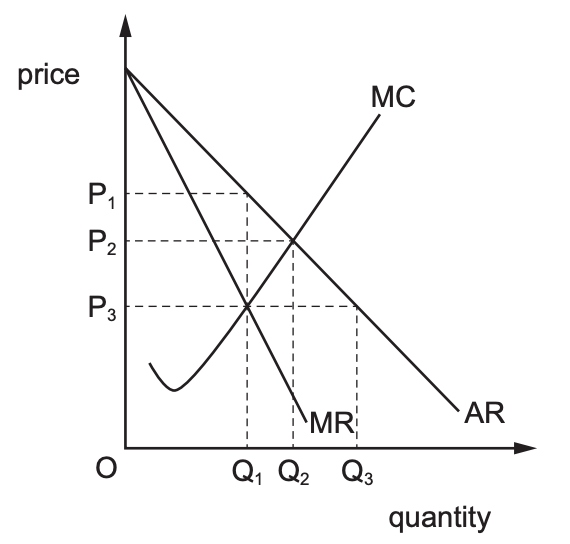
A monopoly was producing at P1Q1 but changed its aim and now produces at P2Q2.
What would not have caused this change?
A It has stock it wants to sell.
B It is concerned about new entrants.
C It wants to benefit from greater economies of scale.
D It wants to maximise profits.
3. A government regards fresh fruit and vegetables as merit goods, and subsidises agriculture to
boost their production.
What could be a government failure arising from these subsidies?
A cheaper fresh fruit and vegetables
B land clearance reducing wildlife
C lower spending on treating dietary illnesses
D more jobs picking fruit and vegetables
4. The table shows a firm that has four possible methods of production. Each method has a different cost and causes a different amount of pollution.
The government decides that polluting firms must buy pollution permits that cost $90 each. Each
permit allows the firm to emit 1 tonne of pollution. No pollution can be emitted without a permit.
Which method of production has least total cost?
| Cost of production ($ per day) | Pollution caused (tonnes per day) | |
| A | 320 | 3 |
| B | 380 | 2 |
| C | 480 | 1 |
| D | 700 | 0 |
5. The table shows the average incomes of the richest 20% of households and the poorest 20% of
households in the UK (2015–2016), and the effects of government taxation and benefits on
average income.
| Average income (£) of richest 20% | Average income (£) of poorest 20% | |
| Before taxes and benefits | 85 000 | 7 000 |
| After direct taxes and cash benefits | 68 000 | 13 000 |
| After all taxes (direct and indirect) and all benefits | 63 000 | 17 000 |
What can be concluded from the information in the table?
A The effects of direct taxation have affected the rich less than the poor.
B The government’s policy achieved income equality across households.
C The government redistributed all income taken from the rich to the poor.
D The government’s policy reduced the income inequality between the poor and the rich.
