1. The diagram shows the indifference curves (IC) for a consumer for goods X and Y together with
the consumer’s budget lines (BL).
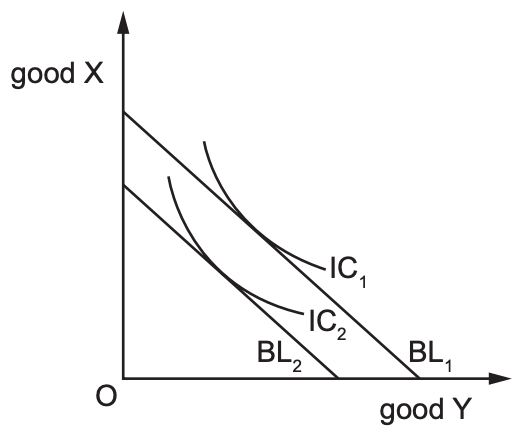
If the budget line shifts from BL1 to BL2, how does this affect the consumer’s preferences for
goods X and Y when prices remain the same?
A He continues to buy the same amounts of X and Y.
B He prefers to buy fewer of X and fewer of Y.
C He prefers to buy fewer of X and more of Y.
D He prefers to buy more of X and fewer of Y.
2. The price of brand X is $2 and the price of brand Y is $1. The consumer has $20 income to
spend on these brands.
Which combinations of the two brands would be points on the same budget line for this
consumer?

3. The diagram shows an industry’s demand and supply curves. The industry increases supply from
S1 to S2.
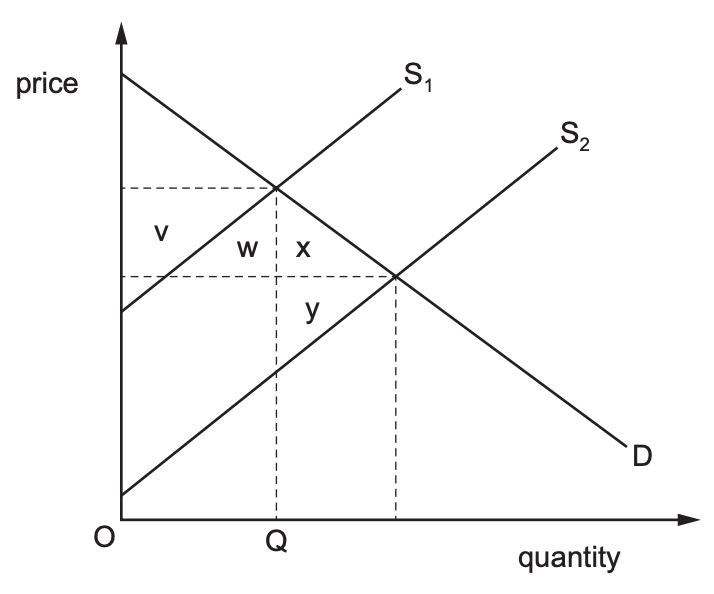
Which area shows the total gain in society’s economic welfare?
A v + w + x B w + x C x + y D (x + y) – (v + w)
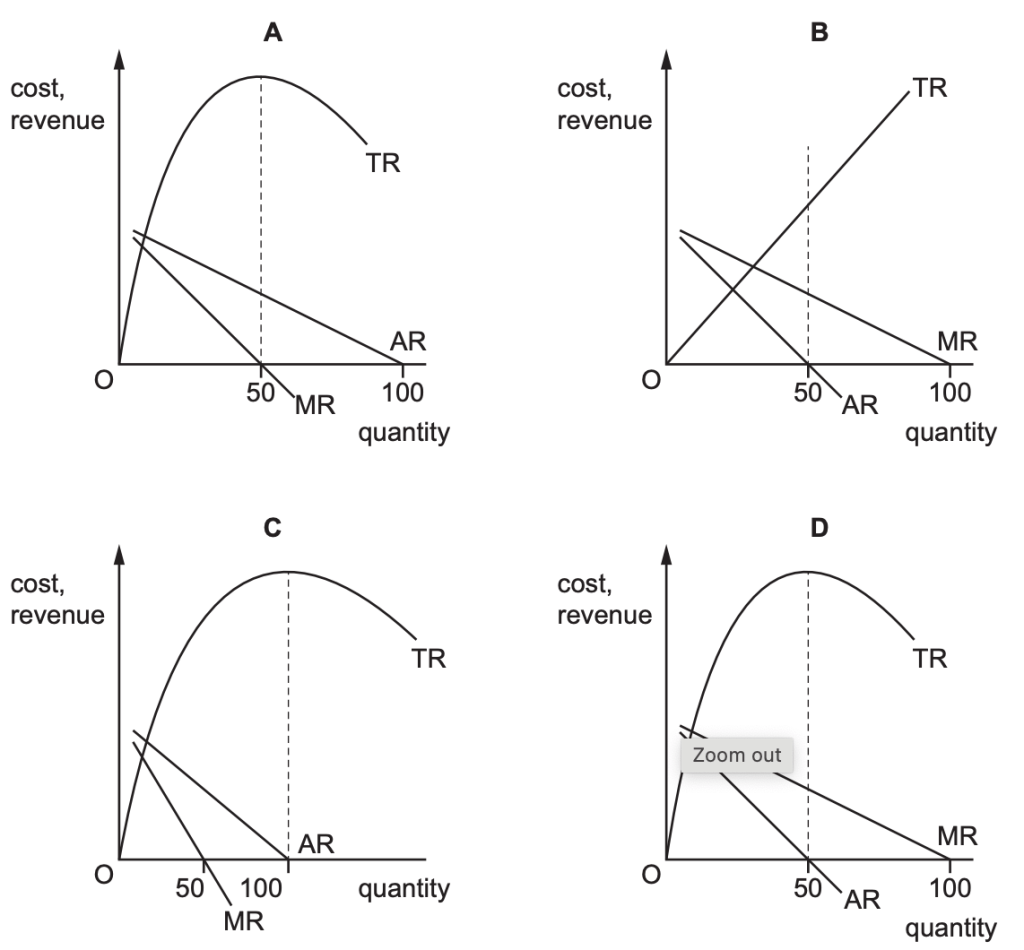
4. Which diagram accurately represents the revenue curves of a producer in imperfect competition?
5. The diagram shows the cost and revenue curves of a firm in a contestable market.
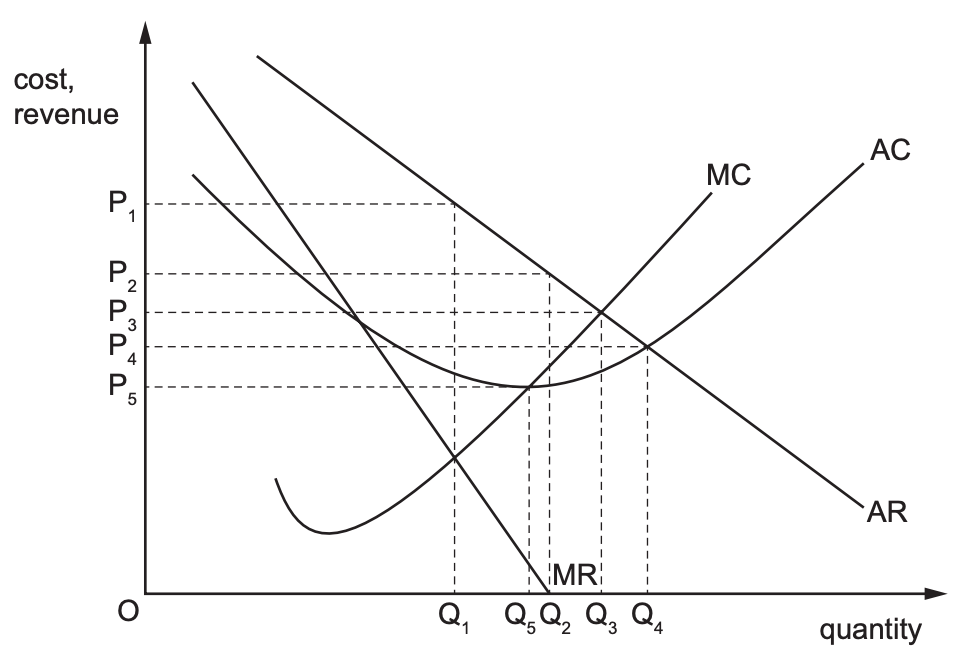
It is currently charging the profit-maximising price OP1. In order to deter entrants the firm decides
to change its aim to sales maximising. What price will achieve this new aim?
A OP2 B OP3 C OP4 D OP5
