1. What is most likely to improve the allocative efficiency of a market?
A a higher market concentration ratio
B collusion between firms in the market
C entry of new firms into the market
D mergers of firms in the market
2. The diagram shows a market in which there are negative externalities of production and positive
externalities of consumption.
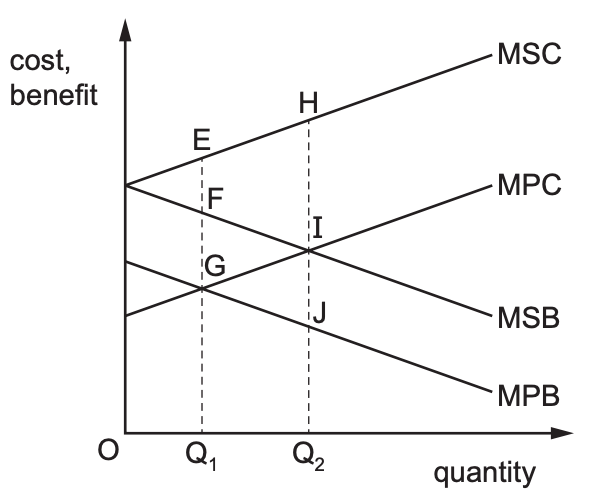
What is the marginal external cost at the free market equilibrium level of output?
A EG B EF C FG D HI
3. What could be included in a cost-benefit analysis of a project to build a road bridge connecting an island community to the mainland?
| A fall in employment for ferry services | An increase in carbon emissions | A reduction in travel time for work | An increase in incomes for the community | |
| A | Yes | No | No | Yes |
| B | Yes | Yes | No | No |
| C | Yes | Yes | Yes | Yes |
| D | No | No | Yes | Yes |
4. The table shows the levels of total and average utility at different levels of a consumer’s weekly
consumption of a product.
| Number consumed per week | Total utility | Average utility |
| 1 | 4 | 4.0 |
| 2 | 9 | 4.5 |
| 3 | 15 | 5.0 |
| 4 | 20 | 5.0 |
| 5 | 24 | 4.8 |
| 6 | 27 | 4.5 |
After which level of weekly consumption does the diminishing marginal utility first occur?
A 3 B 4 C 5 D 6
5. Which statement about a budget line in consumer behaviour theory is correct?
A It illustrates consumer preference between two goods.
B It illustrates combinations of two goods that consumers are able to purchase with a given
income.
C It illustrates the least cost combination of goods that yield the same level of utility.
D It illustrates the income effect of a price change.
