1. The table shows an individual’s planned consumption at different levels of income.
| Income ($) | 100 | 200 | 300 | 400 | 500 |
| Consumption ($) | 140 | 220 | 300 | 380 | 460 |
What can be concluded about changes in the marginal propensity to consume (MPC) and
average propensities to consume (APC) as income rises?
| MPC | APC | |
| A | Constant | Constant |
| B | Constant | Falling |
| C | Falling | Constant |
| D | Falling | Falling |
2. Which items in the table are classified as foreign aid?
| Foreign direct investment | Official development assistance | Portfolio investment flows | |
| A | no | no | yes |
| B | no | yes | no |
| C | yes | no | yes |
| D | yes | yes | no |
3. An increase in which factor will cause a decrease in investment spending?
A business confidence
B company profits
C interest rates
D national income
4. The diagram shows the relationship between tax revenue and the tax rate.
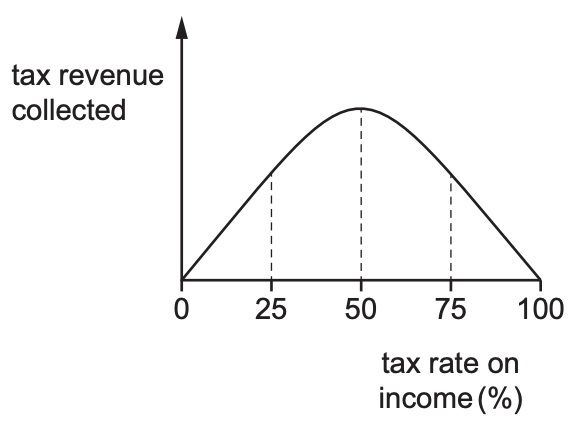
What is the curve on the diagram called?
A income elasticity curve
B J curve
C Lorenz curve
D Laffer curve
5. The table shows the rate of inflation (consumer prices index) and the monthly percentage rate of
unemployment for the USA over a six month period in 2017.
| Month | April | May | June | July | August | September |
| Rate of inflation (%) | 2.2 | 1.9 | 1.6 | 1.7 | 1.9 | 2.2 |
| Rate of unemployment (%) | 3.9 | 3.8 | 3.9 | 3.9 | 3.8 | 3.7 |
What can be concluded from this table?
A Falling inflation leads to lower unemployment.
B Increasing inflation leads to rising unemployment.
C The rate of inflation correlates exactly with the rate of unemployment.
D The rate of inflation has a marginal effect on the rate of unemployment.
