1. What is the main aim of cost-benefit analysis?
A to allow firms to maximise their private benefit and minimise the external cost
B to equate total social benefit to the total social cost of a project
C to find the correct level of direct tax to internalise the external cost of a project
D to find the highest positive difference between total benefit and total cost
2. The diagram shows a firm in perfect competition that creates pollution.
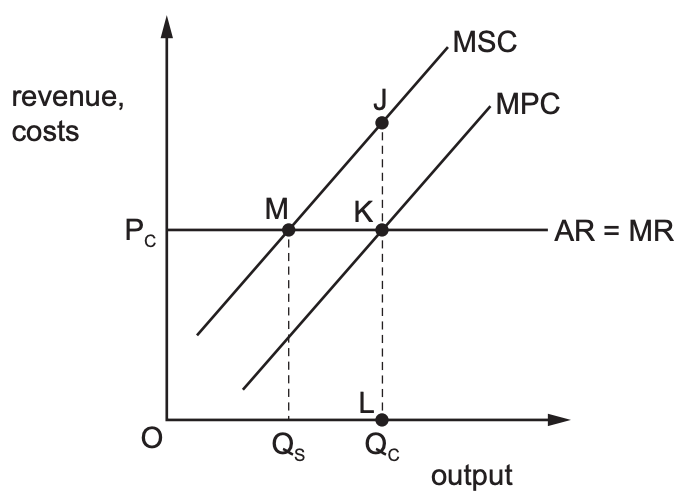
What represents the external cost?
A JK B JM C KL D MK
3 What is achieved in monopolistic competition in the long run?
| Allocative efficiency | Supernormal profit | |
| A | No | No |
| B | No | Yes |
| C | Yes | No |
| D | Yes | Yes |
4. The table contains data on the total utility gained by a consumer from eating biscuits and
chocolates in one day.
| Biscuits / chocolates eaten | Total utility (units) | Total utility (units) |
| Biscuits | Chocolates | |
| 1 | 20 | 10 |
| 2 | 38 | 20 |
| 3 | 52 | 32 |
| 4 | 62 | 38 |
| 5 | 70 | 42 |
| 6 | 74 | 42 |
| 7 | 74 | 40 |
What can be concluded from the table?
A The consumer gets diminishing marginal utility after eating the first chocolate.
B The consumer gets negative marginal utility from the seventh chocolate eaten.
C The consumer will never eat chocolates if biscuits are available.
D The second biscuit eaten gives the same marginal utility as the fourth chocolate eaten.
5. The indifference curve diagram shows the effect of an increase in income on the consumption of good X and good Y.
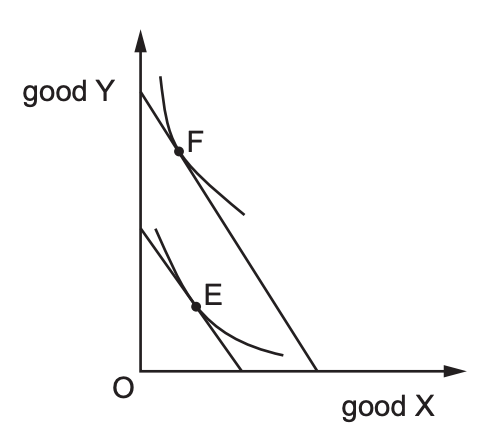
Which types of good X and good Y are indicated by the change in consumption from E to F?
| Good X | Good Y | |
| A | Inferior | Inferior |
| B | Inferior | Normal |
| C | Normal | Inferior |
| D | Normal | Normal |
