1. The table shows the total revenue and marginal cost of a firm at different levels of production.
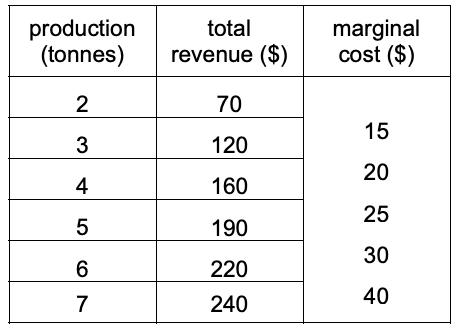
Within which output range will the firm’s profits be maximised?
A 2–3 tonnes
B 3–4 tonnes
C 5–6 tonnes
D 6–7 tonnes
2. The diagram shows a profit-maximising firm’s cost and revenue curves.

What would be the increase in the firm’s output if it was required to charge a price equal to marginal cost?
A WX B WY C XY D XZ
3. What must be different between the consumers of a product to enable profitable price
discrimination by the producer?
A levels of income
B price elasticities of demand
C the ages of the consumers
D time of consumption
4. An example of forward vertical integration for a computer manufacturer would be a merger with
A another computer manufacturer.
B a computer retailer.
C a silicon chip manufacturer.
D a software developer.
5. The diagram shows the short-run cost curves and the long-run average cost curve for a firm.
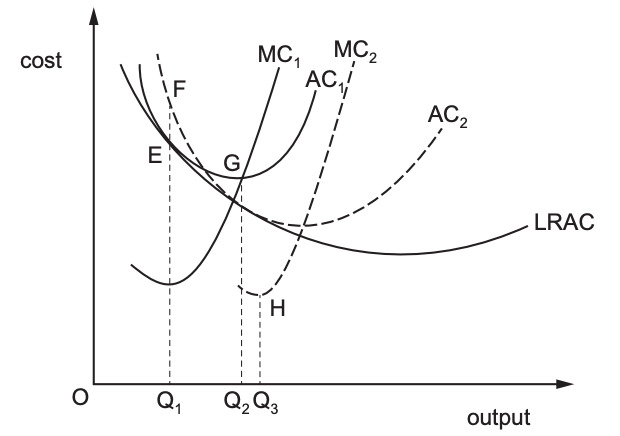
What can be concluded from the diagram?
A At output Q1, point E represents a productively efficient position.
B At output Q1, point F is preferred to point E because curve AC2 represents economies of
scale.
C Point G at output Q2 is productively efficient in the long run.
D The biggest profits are made at point H at output Q3, which is the lowest marginal cost
position.
