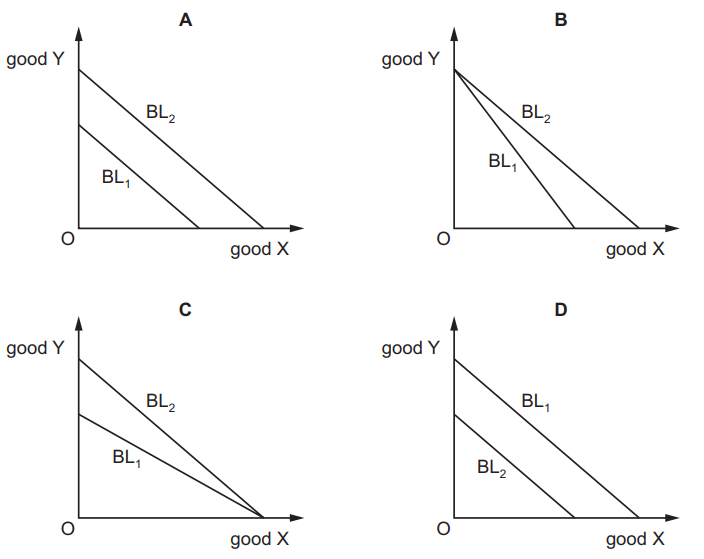
1. The diagrams show changes in a consumer’s budget line (BL) for two goods.
The government increases the price of both goods by imposing a sales tax of 25%.
Which diagram shows the effect of this tax?
2. A consumer demands two goods, X and Y. The consumer’s initial equilibrium is at R and final
equilibrium at T. The indifference curve diagram shows the effect of a fall in the price of good X
and the resulting income and substitution effects.
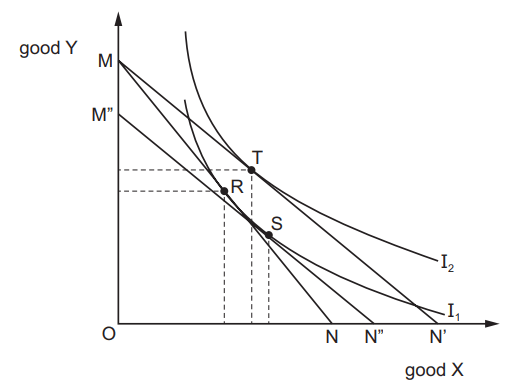
What can be concluded from the diagram about the nature of good X and the nature of its
relationship with good Y?
| Nature of good X | Relationship between good X and good Y | |
| A | Inferior | Complements |
| B | Inferior | Substitutes |
| C | Normal | Complements |
| D | Normal | Substitutes |
3. A perfectly competitive firm is producing a level of output where average cost is lower than
marginal cost.
What are the effects on these costs if output increases by one unit?
| Average cost | Marginal cost | |
| A | Falls | Falls |
| B | Falls | Rises |
| C | Rises | Falls |
| D | Rises | Rises |
4. What is most likely to pose a threat to the survival of small local bread producers?
A an increase in the cost per minute of television advertising
B a switch in consumer preferences to cheaper mass-produced bread
C diseconomies of scale in the process of bread production
D increased congestion on road networks
5. Firms in a market advertise their products with different brand names. Some make more profit
than others in the short run but all make normal profit in the long run.
Which market structure is this?
A perfect competition
B monopolistic competition
C oligopoly
D monopoly
