1. The diagram shows a consumer’s total utility.
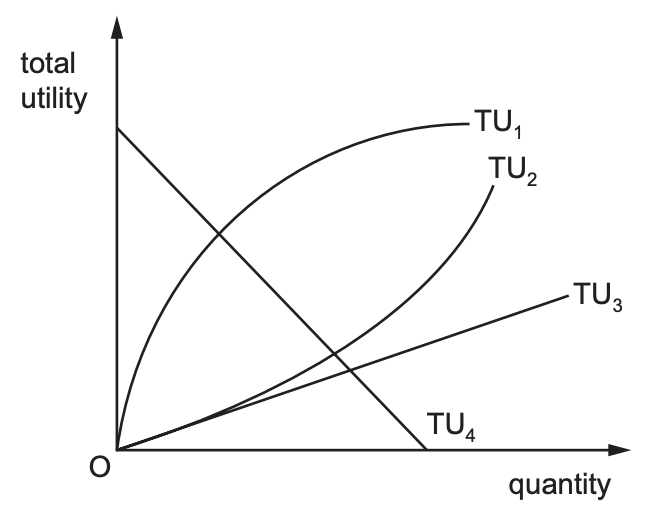
Which curve would mean that marginal utility is diminishing?
A TU1 B TU2 C TU3 D TU4
2. Which is an internal economy of scale?
A cheaper loans from a local bank resulting from a merger
B efficient local transport networks
C specialist training facilities provided by a local college
D the reputation of an area for a particular product.
3. Why might a firm continue in production in the short run even though the price of its product has fallen below its average total costs of production?
A It anticipates a rise in variable costs.
B It expects the fall in price to be temporary.
C It has large fixed costs of production.
D It has no control over the price of its product.
4. The diagram shows that a producer increases output from Q1 to Q2.
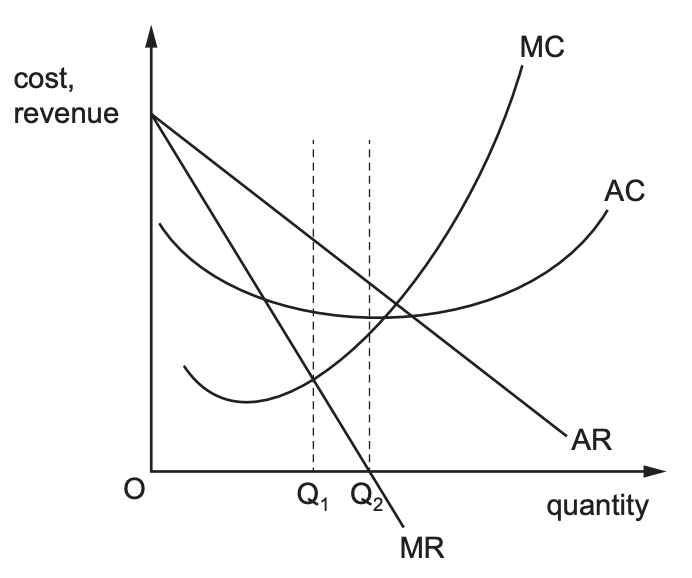
What will be the result?
| Total profit | Total revenue | |
| A | Increased | Increased |
| B | Increased | Reduced |
| C | Reduced | Increased |
| D | Reduced | Reduced |
5. What is true about economies of scale but not diseconomies of scale?
A They occur because average revenue is increasing.
B They occur because of management policy changes.
C They occur in the short run.
D They occur with decreasing average cost.
