Initial Task

Poverty

Economists distinguish between:
- Absolute poverty, where a household’s income is insufficient to purchase the minimum bundle of goods and services necessary to sustain human life (this is often considered to be just over $1 a day); and
- Relative poverty, defined in the UK as when a household’s income is below 50% of median household income.
As well as knowing the number of people below the poverty line, it is important to know how far below the line they are. The income gap is a useful way of measuring the intensity of poverty as well as its incidence.
Inequality is a broader concept considering the overall distribution of income and wealth in society. One measure is to consider the ratio of the richest 20% of households to the poorest 20% (the quintile income ratio).
Lorenz Curve
We depict the distribution of income in a country with Lorenz curves. Several are shown below:
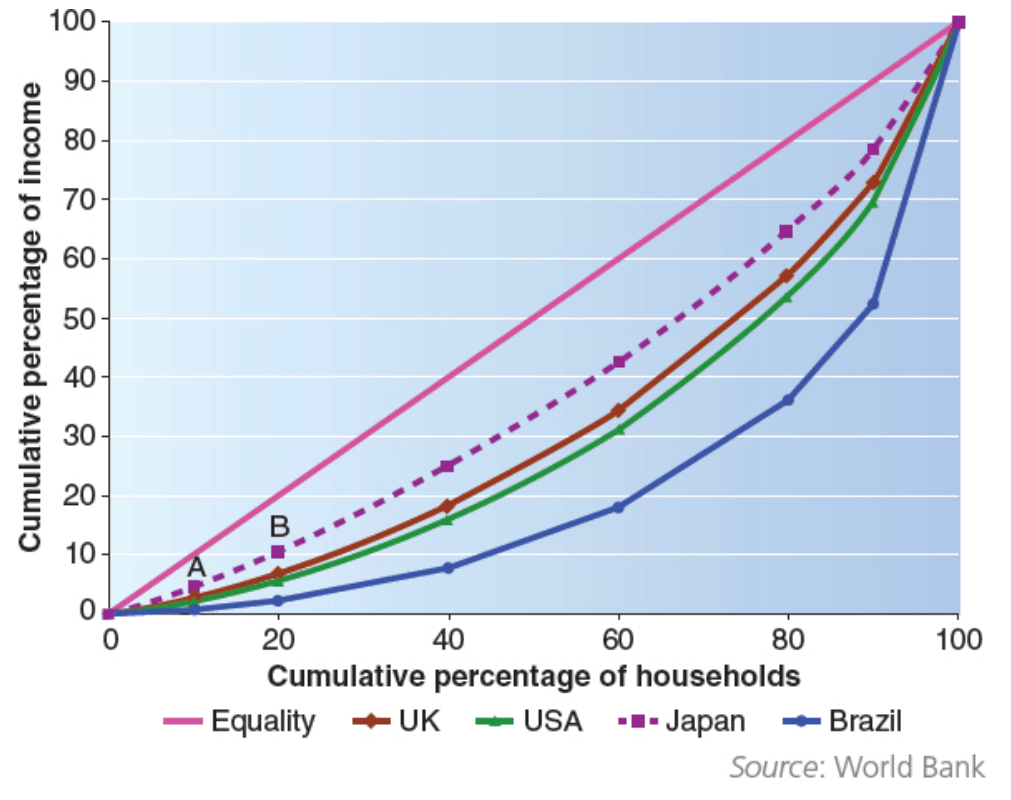
To construct a Lorenz curve, first the households in a country are ranked in order of income, then we calculate the percentage of total income accounted for by each decile (10% bracket) of households. This gives us the ten points to plot on the graph. A straight line indicates perfectly equal distribution and the deeper the curve the more substantial the inequalities in the country.
Task

Gini Index
Lorenz curves would be unclear if we wanted to compare a large number of countries. For this we can use the Gini Index, calculated as shown below:
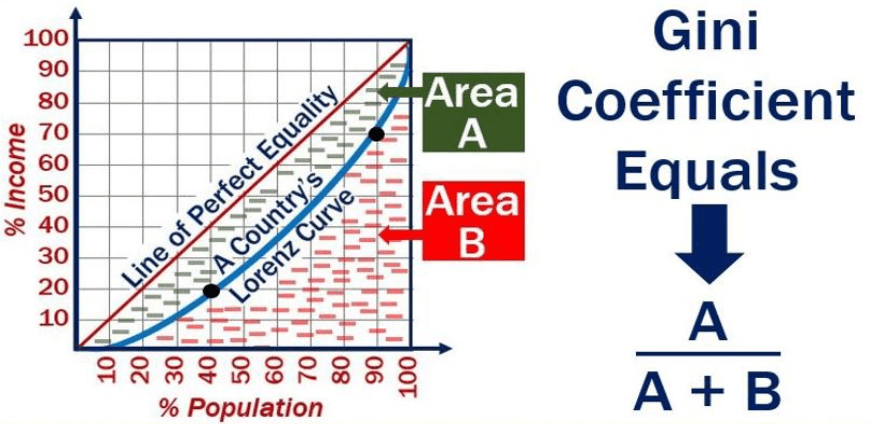
In developed countries a Gini coefficient of 0.3 to 0.4 is common. A higher coefficient indicates greater inequality. Check the coefficients for countries that are relevant to you.
Causes of Inequality and Poverty
- Labour market – In the next section (separate webpage) we look in detail at how the labour market can lead to inequalities in earnings due to change in demand and supply conditions in labour markets as a response to changes in consumer demand and changes in international comparative advantage between countries. Changes in the structure of the economy can also lead to rising inequality between certain groups in society (e.g. a move away from unskilled work towards occupations requiring a higher level of skills and qualifications). We also consider the impact of trade unions.
- Ownership of assets – Most visibly, ownership of assets influences inequality through inheritance, as families accumulate wealth (i.e. not due to the operations of markets). We must distinguish clearly between wealth and income. However, inequality in wealth can often lead to inequality in income (e.g. as wealth leads to an income flow, from rents and profits).
- Demographic change – Many countries have recently seen a change in the age structure of the population, due to improvements in medicine and lower fertility rates. This has increased the number of people reliant on pensions and decreased the number of people of working age generating the funds for such pensions.
Government intervention can influence the distribution of income in society, most noticeably through benefits (both transfer payments and benefits in kind, such as health and education) and taxation, particularly through progressive direct taxes. Note that with income tax, the marginal tax rate increases as income increases, ensuring that it reduces inequality in income distribution. Note also that indirect taxes are often regressive, as their impact is felt more heavily by lower-income households. We look at how a sales tax can affect total welfare in society in the diagram below:

Imagine that the government has imposed a specific tax on DVDs, which takes the price from the market equilibrium price of P* up to Pt (and reduces quantity sold from Q* to Qt). As previously seen, the price rises by less than the tax, so the incidence of the tax falls partly on consumers and partly on producers. Able we see that consumers pay most of the tax (PtBP*E, compared with P*EGF paid by the producers).
The total welfare that society receives from consuming a product is the sum of the consumer and producer surplus. Before the tax, this is AP*C + P*CH and after the tax this is the smaller area APtB + FGH and government revenue raised is PtBGF (this should be included in total welfare, on the assumption that the government spends it wisely). Hence there is a deadweight loss of the area of triangle BCG, sometimes called the excess burden of the tax.
Poverty Trap
If means-tested benefits coexist with a progressive income tax structure it is possible for a poverty trap to exist, where people are disincentivised from working (or from increasing work hours), as the commensurate loss in benefits would mean they were no better off (or even worse off). One way that has been proposed to avoid this is a negative income tax below a certain level (instead of benefits), but this only exists at present as a theoretical possibility.
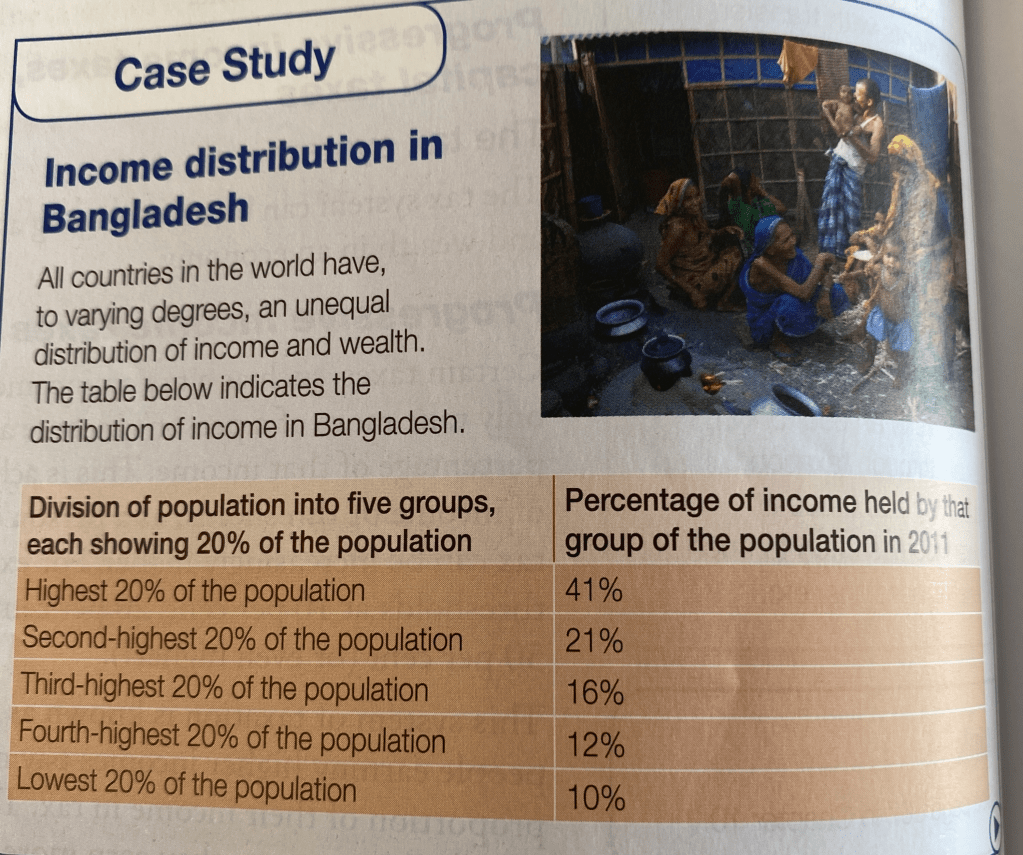
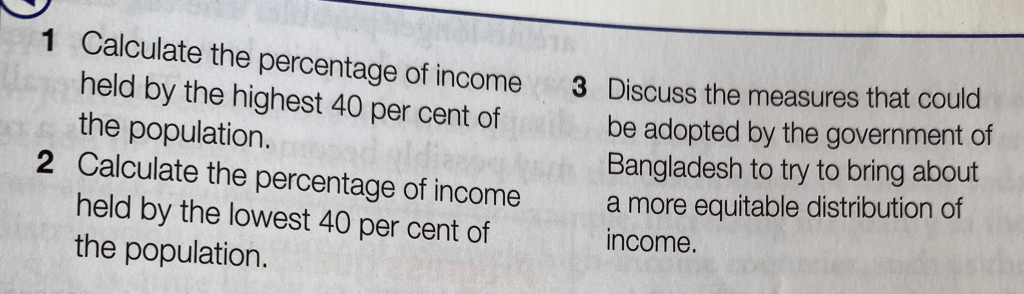
Task 1 – Tax in Bangladesh
Task 2 – Negative Income Tax in Canada
Prohibition
Governments can attempt to prevent the consumption of a demerit good by making it illegal. Below is a graph indicating how this could affect the market for heroine (assuming that the prohibition was not able to be completely successful):

The curve of the demand curve is due to a hardcore of addicts for whom demand for the drug would be highly inelastic, and a number of “recreational users” who would stop using the drug if the price increased. Hence, up to a point, a prohibition could lead to a significant decrease in the quantity of the drug consumed, but further efforts to enforce the prohibition would likely only drive prices even higher, without effectively further reducing the quantity consumed. This could also lead to other negative externalities, such as muggings and robberies by addicts to finance the increasing price of their addiction.
Task – Cash handouts
Equity and efficiency
Policies often seek a balance between efficiency and equity. For instance, a tax on tobacco introduced to correct a market failure may fall disproportionately on low-income groups within society, so some balance may be needed to correct for its redistributive effects.
Instability of prices (e.g. commodity prices) poses a significant risk to businesses (both those selling the commodities and those buying them). Governments may take measures to try and stabilise prices, for instance a buffer stock scheme which invests in a commodity when supply is buoyant and prices are low and then sells it when supply is low and prices are high, effectively stabilising the price within the domestic economy. Such a scheme can be costly to operate though, as the storage costs are often considerable.
| Advantages of a buffer stock scheme | Disadvantages of a buffer stock scheme |
| Overcomes the problem of wide fluctuation in prices from one year to the next. | It can be difficult for the government to establish what the equilibrium price in the commodity market should be. Producers will want the highest possible price maintained, whereas consumers will want the lowest possible price maintained. |
| Stabilising prices through a buffer stock scheme will lead to greater stability in the incomes that producers, such as farmers, receive. | Cost of operating buffer stock scheme must be paid by someone. There are different opinions about this. The government may decide to pay for the scheme, or it may want producers to contribute to the cost. |
| Stability in incomes will encourage producers to make long-term plans. | A succession of good harvests may be problematic as it may be difficult to store all the stock and there may be concerns about perishability. Conversely, if there is a succession of poor harvests, it may not be possible to store sufficient supplies. |
Incentives and Nudge Theory
Choosing effective incentives is a crucial aspect of designing microeconomic policy. Traditional economics assumes that people act rationally and respond primarily to price signals, however modern behavioural economics suggests that this is not necessarily the case. People may make decision based on habit, buy goods on impulse, or make decisions based on humanitarian motives or a sense of loyalty.
Nudge theory looks at how the government can encourage people to behave in a way that is beneficial for society (without using mandates). One example of this could be encouraging shops to display healthy foods in more prominent positions, or putting up signs saying “Take your litter home – other people do” that aim to get an emotional / conscience based response leading to actions that benefit society.
Task
Discuss in groups how you would design a policy or campaign to encourage social behaviour by people in your neighbourhood.
Government failure is when a misallocation of resources occurs due to government intervention. Often this is due to the government intervention causing unanticipated market distortions that counteract their intended effects. All interventions involve costs, including those of administering and monitoring the intervention policy. The marginal costs of intervention policies should not outweigh the marginal benefits.
Closing Task

