Introductory Task
Labour Productivity
Labour productivity is the quantity of goods and services that a worker can produce in a given period of time (typically an hour). Increasing labour productivity increases an economy’s productive potential. This can be done by improved education and training, greater experience, and access to improved capital equipment.
Task – Productivity
Unemployment
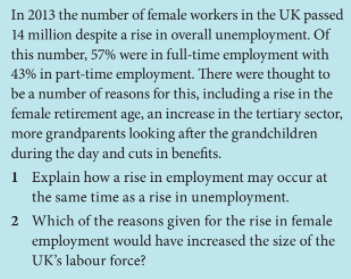
A person is defined as unemployed if they are willing and able to work, but cannot find a job. The level of unemployment is the total number of unemployed people, and the rate of unemployment is the number of employed people as a percentage of the labour force.
An unemployment rate below 3% is considered to be full unemployment – it is unrealistic to set this at 0%, because at any given time some people experience a period of unemployment as they move from one job to another. The natural rate of unemployment, also known as the non-accelerating inflation rate of unemployment (“Nairu”) is a monetarist concept referring to the situation where aggregate demand for labour equals aggregate supply of labour at the current wage rate and price level. Monetarists argue that this cannot be reduced in the long run by monetary or fiscal policy, but that it can change over time. It is driven by supply side factors and can fall due to:
- Increased mobility of labour;
- Improvement in education and training of workers;
- Reduction in trade union restrictive practices;
- Reduction in state unemployment benefits; and
- Cuts in income tax.
Causes of unemployment
There are three types of unemployment, each with different causes:
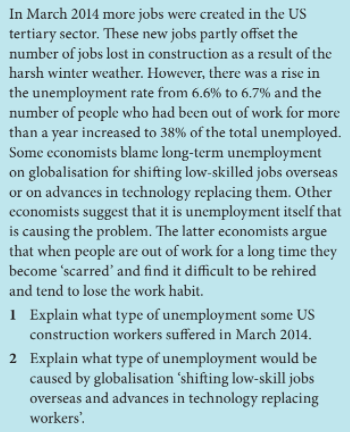
- Frictional: Unemployment when workers are between jobs, e.g. when they are looking for a new job but don’t accept the first job offered as they hold out for higher pay. Also includes casual and seasonal employment, where workers such as journalists, construction workers and workers in tourist industries have periods during the year when they are out of work.
- Structural: Reflects structural changes in the economy, due to some industries expanding and others contracting (or physically relocating). This can include technological unemployment, where people are replaced by machines. It can also include international employment, where domestic industries declined due to the increased competitiveness of foreign rivals.
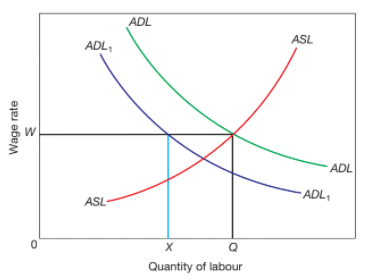
- Cyclical. Unlike the above two types, this is driven by the demand side of the economy, due specifically to a lack of demand. It affects the whole economy, with job losses occurring across a range of industries. The below diagram shows the labour market initially in equilibrium at a wage rate of W and then due to a fall in aggregate demand, firms reduce output and aggregate demand for labour shifts to ADL1. If workers resist wage cuts, demand-deficient unemployment XQ will exist. Even if wage rates fall, this type of unemployment can persist, because cutting wages leads to people having less money to spend, reducing demand for goods and services, causing firms to further reduce output and make more workers redundant.
In addition to the aggregate supply of labour (ASL) curve, we should include an aggregate labour force (ALF) curve on our diagrams related to employment as demonstrated in the following two diagrams:
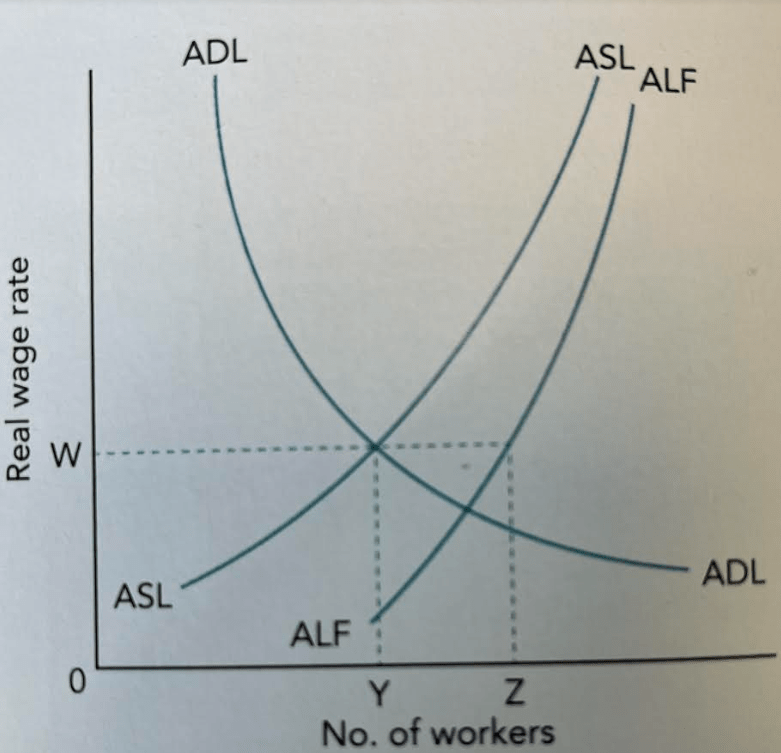
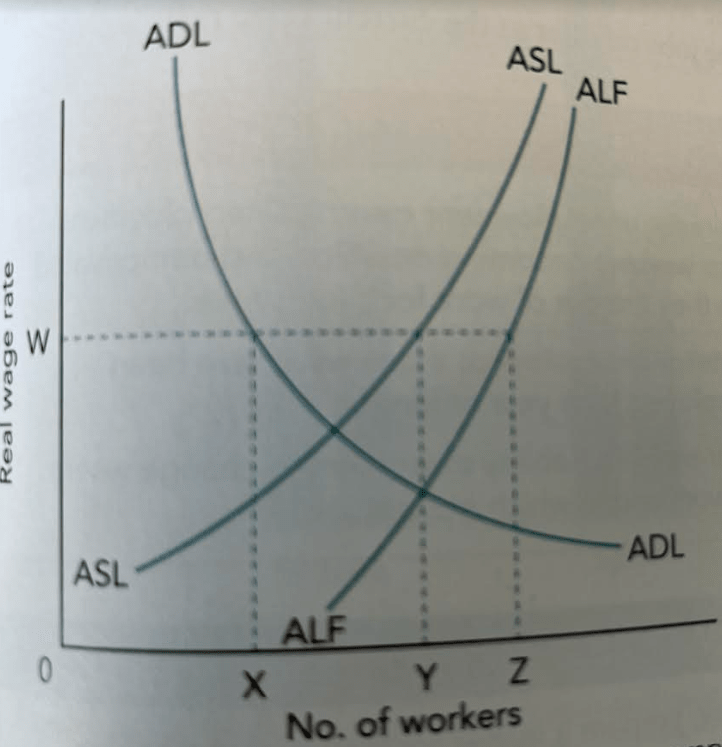
The top diagram, demonstrating equilibrium unemployment, shows that at a wage rate of W, there are Y workers employed. YZ shows workers experiencing voluntary unemployment (frictional and structural unemployment). This unemployment is due to the supply side.
The lower diagram shows simultaneous equilibrium and disequilibrium employment in an economy. The economy is shown as experiencing XZ amount of unemployment, where XY is disequilibrium unemployment (equivalent to cyclical unemployment, this is unemployment that arises when the aggregate supply of labour is greater than the aggregate demand for labour at the current wage rate) and YZ is equilibrium unemployment.
The ALF curve includes those prepared to work at the real wage rate of W and unable to find a job, those seeking better paid jobs, those inbetween jobs, and thos who can’t do the jobs on offer due to a lack of occupational or geographical mobility. This curve tends towards the ASL curve as the real wage rate rises, as a higher proportion of the labour force are willing to accept the wage rate.
Consequences of Unemployment
Unemployment affects the unemployed individuals, firms and the economy as a whole.
- Individuals: The unemployed individuals will normally experience a fall in income. Also, the longer they are unemployed, the harder they may find it to get a further job, as they miss out on training and become out of touch with changes in technology. They can also suffer a decline in their physical and mental well-being. Hysteresis refers to unemployment causing unemployment due to workers becoming deskilled and demotivated when they are out of work for a long time.
- Firms: Firms seeking expansion may have a greater choice of potential workers and may benefit from workers not pushing for wage rises for fear of losing their jobs. They may, however, suffer from lower demand for their goods and services (considering that the unemployed are also consumers).
- Economy: There will be an opportunity cost as output is below its potential level. As unemployed are not working, fewer goods and services are being produced, and living standards are not increasing as much as they might. Tax revenue received by the government will also be lower and if state benefits are paid by the government, then the amount spent on these will increase.
Task – Unemployment
Task 2 – Unemployment
Patterns and Trends in Unemployment
Patterns of employment typically change over time, as workers become more skilled and comparative advantage changes. Typically the proportion of the labour force employed in the primary sector declines and the proportion in the secondary sector and eventually the tertiary sector rises.
Measuring Unemployment
The government uses 2 main measures of unemployment:
- Claimant Count measures the number of people receiving unemployment-related benefits. This is relatively cheap and quick to calculate, however may not be entirely accurate, as may include some people who are not really unemployed or omit some people who are genuinely unemployed. Some people receiving employment benefits may not be actively seeking employment (voluntary employment), whilst some may have undeclared work. Some groups may be seeking employment but not feature in the official figures, including those above the retirement age, those on government training schemes and those who prefer not to claim benefits.
- Labour Force Survey uses the International Labour Organisation (“ILO”) definition of unemployment, including anyone of working age who is without work, but is available for work in the following two weeks and is seeking paid employment. This measure picks up some individuals not picked up by the claimant count. It is also useful for international comparisons, as it is based on an international standardised definition. However, the data is more expensive and time consuming to collect, and being based on a sample survey is subject to sampling error and various practical problems relating to data collection.
Task

Policies to correct unemployment
Government can reduce cyclical unemployment using reflationary fiscal or monetary policy measures to increase aggregate demand. On the fiscal side, these include:
- Reduction in indirect or direct taxation to increase consumer expenditure;
- Reduction in corporate tax to stimulate investment;
- Increase in government spending.
On the monetary side, these include:
- Reduction in the interest rate to increase consumer expenditure and investment;
- Increasing money supply to increase consumer expenditure and investment;
- Lowering the exchange rate, through formal devaluation or intervention in the FX market, to increase net exports.
The impact of these reflationary measures will depend upon the size of the multiplier (discussed in previous section) and the response from consumers and firms.
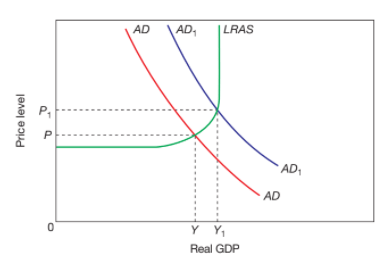
It can also be challenging to get the size of changes right. The below diagram shows aggregate demand increasing and eliminating a negative output gap, but at the cost of increasing the price level:
To reduce frictional and structural employment a government will likely introduce supply side policy measures, such as reducing unemployment benefit and income tax rates to reward working and discourage periods of unemployment. Improved education and training can also increase workers’ occupational mobility and thus reduce structural unemployment. Trade union reform can help to prevent trade union pushing wage rates above equilibrium levels, hence increasing the efficiency of the country’s labour markets.
Final Task